


Figure 1.
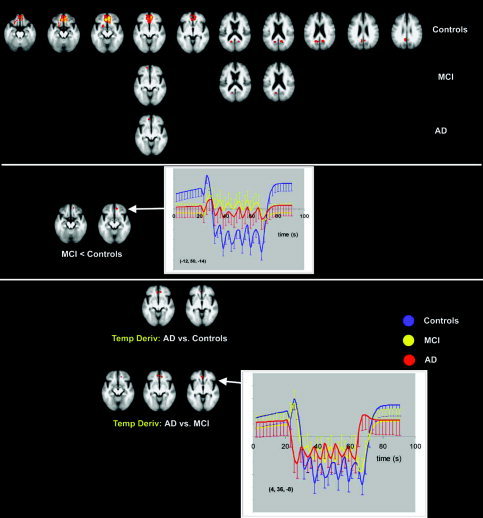
Transverse sections with Z‐statistics of average deactivation in controls, MCI, and AD (top) during the face‐encoding task (P < 0.05, corrected). Z‐scores are color‐coded from 3.1 (red) to 6.2 (yellow). The graphs show the estimated responses with standard deviations. The underlying structural image is the average image of all controls and patients; left in image is left in the brain. MCI show less deactivation in the medial frontal gyrus than controls (middle). AD show a change in the early phase of deactivation (temporal derivative) compared to both MCI and controls (bottom) in the anterior cingulate gyrus.