


Figure 2.
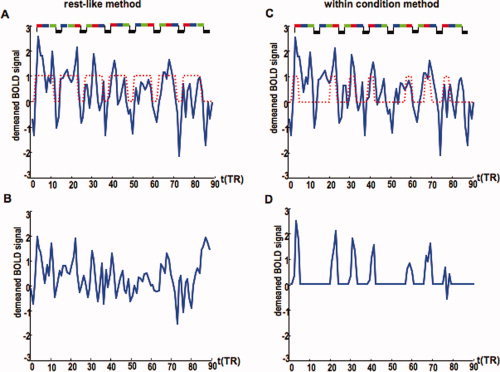
The functional connectivity estimation methods. For simplicity, only one session is represented. The rest‐like method: (A) The demeaned time courses extracted from A2R in one subject. A delayed box‐car model (2 × TR) is superposed on the time course (dotted line). The experimental paradigm is represented at the top of the panel; each condition lasted for 9 s (3 × TR) and is represented by a different color: red‐binaural presentation; blue‐left ear presentation; green‐right ear presentation; black‐baseline. (B) The residual time course after the stimulus induced response estimated as the average across the seven blocks in (A) was regressed out. The within‐condition method: (C) The demeaned time course extracted from A2R in one subject with the delayed box‐car regressor for the binaural condition represented by the dotted line. (D) The time points corresponding to the binaural condition extracted from the time course in (C). Prior to connectivity estimation, the first volume in each block was discarded and the remaining time points were concatenated to create the time course corresponding to the binaural condition. The time courses corresponding to the left and right ear presentation were estimated in a similar way. [Color figure can be viewed in the online issue, which is available at www.interscience.wiley.com.]