


Figure 6.
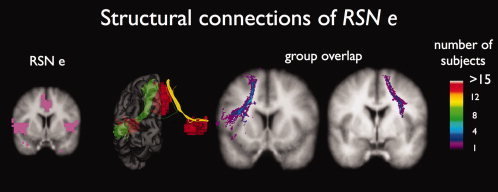
Interconnecting tracts between regions of the core network (RSN e). Fiber tracking revealed interconnecting tracts between the ACC region and the left/right insular regions of RSN e in part of the subjects (16 of 26 and 10 of 26, respectively). Group consistency maps showed a high variation of the interconnecting tracts over the group of subjects, indicated by the maximum consistency voxel values of 5 and 3, respectively.