


Figure 2.
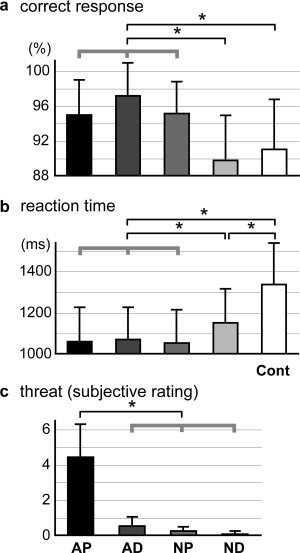
Behavioral data. The mean percent correct responses (a) and mean reaction times (b) for the judgment as to whether either actor had an object in his/her hand during the fMRI experiment are shown for the five picture conditions. (c) The mean scores for the degree of threat of the situations self‐evaluated after the fMRI experiments (9‐point scale) are given for the four conditions of interest. Asterisks on the lines at the top of the graph indicate significant differences between conditions (P < 0.05, Tukey test after ANOVA). Thick gray lines indicate that the behavioral data in the three conditions were comparable (no significant difference) and significantly different from the other condition(s). Error bars indicate standard deviations.