


Figure 2.
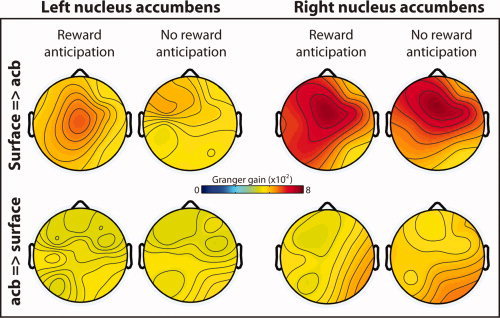
Topographical distribution of directed synchrony during the anticipation delay, estimated through Granger causality. Hotter colors indicate increased directed synchrony from the surface EEG electrodes to the left and right nucleus accumbens (top row) and weaker directed synchrony from the nuclei accumbens to the surface EEG electrodes (bottom row). Data are averaged from 600 to 1,800 ms, 1–4 Hz. This time window was selected to exclude transient stimulus‐evoked dynamics. [Color figure can be viewed in the online issue, which is available at wileyonlinelibrary.com.]