


Figure 4.
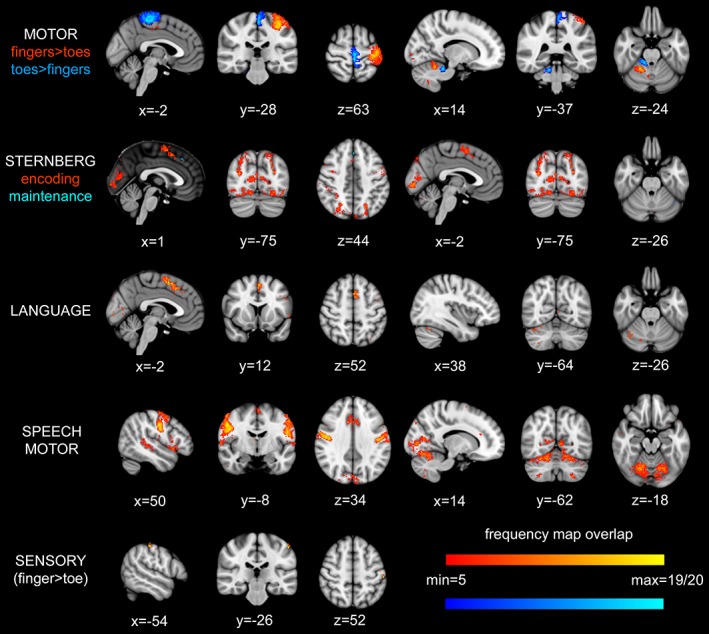
Frequency maps demonstrating the degree of spatial overlap between participants for each paradigm. Statistical maps for each subject were binarised and transformed to standard space where they were added together, a maximum intensity of 19|20 (yellow, light blue) therefore indicated that there was activation at that location in all subjects while an arbitrary minimum of 5 (red, dark blue) out of 19|20 subjects was used for visualisation purposes. For the MOTOR and STERNBERG frequency maps, the two different colours used to represent the degree of overlap in different contrasts within each of these tasks, please see the colour coding below the task name to the left of the images. Note. For cognitive contrasts, only 19 subjects were included in frequency maps, see text for details. For details of location of maximal overlap, see Table S12, Supporting Information [Color figure can be viewed at http://wileyonlinelibrary.com]