


Fig. 7.
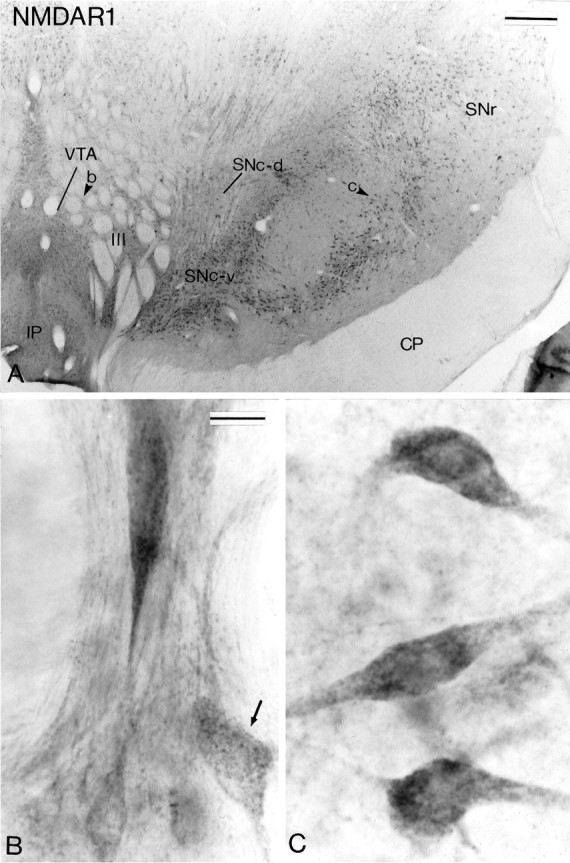
NMDAR1 subunit immunoreactivity in midbrain dopaminergic neurons. A shows a low-power view of a transverse section taken at the level of the middle one-third of the substantia nigra that has been processed for the localization of NMDAR1 subunit immunoreactivity. The arrowheads in theVTA and the SNc indicate regions shown at higher magnification in B and C, respectively. Note in B the difference in the intensity of immunostaining between neurons in the VTA. The arrowindicates one of the lightly stained neurons. Scale bars:A, 0.5 mm; B, C (shown inB), 20 μm.