


Fig. 1.
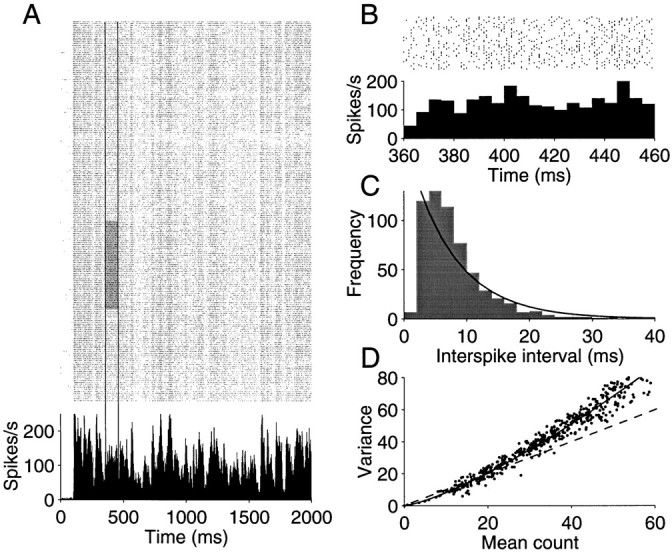
Response variability of a neuron recorded from area MT of an alert monkey. A, Raster and peristimulus time histogram (PSTH) depicting response for 210 presentations of an identical random dot motion stimulus. The motion stimulus was shown for 2 sec. Raster points represent the occurrence of action potentials. The PSTH plots the spike rate, averaged in 2 msec bins, as a function of time from the onset of the visual stimulus. The response modulates between 15 and 220 impulses/sec. Vertical lines delineate a period in which spike rate was fairly constant. The gray region shows 50 trials from this epoch, which were used to construct B and C. B, Magnified view of the shaded region of the raster in A. The spike rate, computed in 5 msec bins, is fairly constant. Notice that the magnified raster reveals substantial variability in the timing of individual spikes. C, Frequency histogram depicting the spike intervals in B. The solid line is the best fitting exponential probability density function. D, Variance of the spike count is plotted against the mean number of spikes obtained from randomly chosen rectangular regions of the raster in A. Eachpoint represents the mean and variance of the spikes counted from 50 to 200 adjacent trials in an epoch from 100 to 500 msec long. The shaded region of A would be one such example. The best fitting power law is shown by the solid curve. Thedashed line is the expected relationship for a Poisson point process.