


Fig. 1.
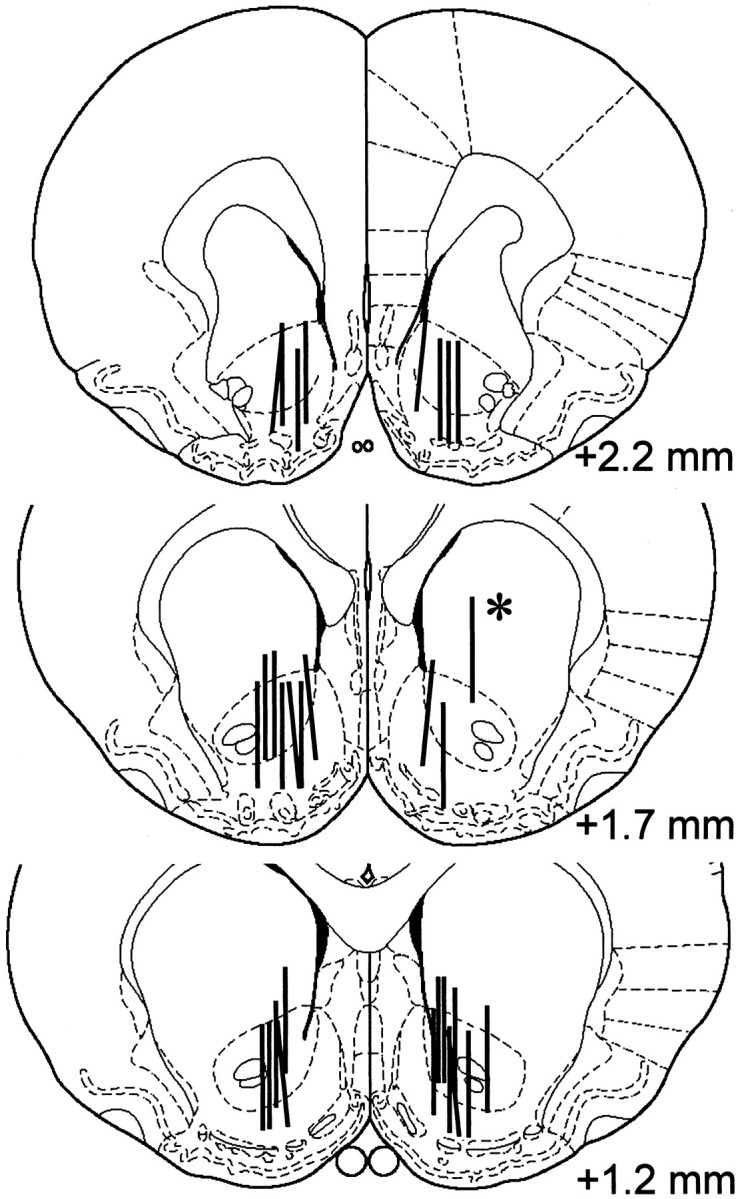
Histological representation of probe placements in NAC. Coronal sections are reproduced from Paxinos and Watson (1997).Vertical bars represent the 2 mm exposed membrane of each microdialysis probe. Probes were implanted at random in the left or right hemisphere. Asterisks indicate probe placements that were excluded from data analysis.