


Fig. 8.
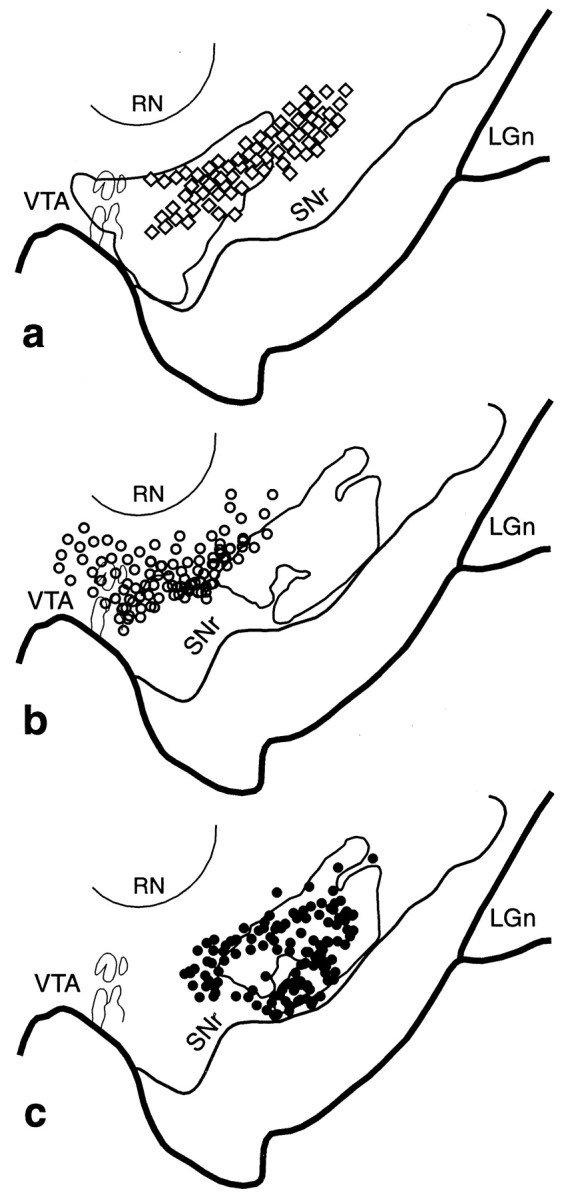
VMS–CS–DLS cell and terminal overlap in the midbrain. a, Schematic of the midbrain comparing the combined distribution of labeled terminals (outline) from all VMS tracer injections with that of cells (diamonds; each = 4–6 cells) that project to the CS. b, Schema comparing the combined distribution of labeled terminals (outline) from all CS tracer injections with that of cells (open circles; each = 4–6 cells) that project to the VMS. c, Schema comparing the combined distribution of labeled CS terminals (outline) with that of cells (black circles; each = 4–6 cells) that project to the DLS.LGn, Lateral geniculate nucleus; RN, red nucleus; SNr, substantia nigra, pars reticulata;VTA, ventral tegmental area.