


Fig. 2.
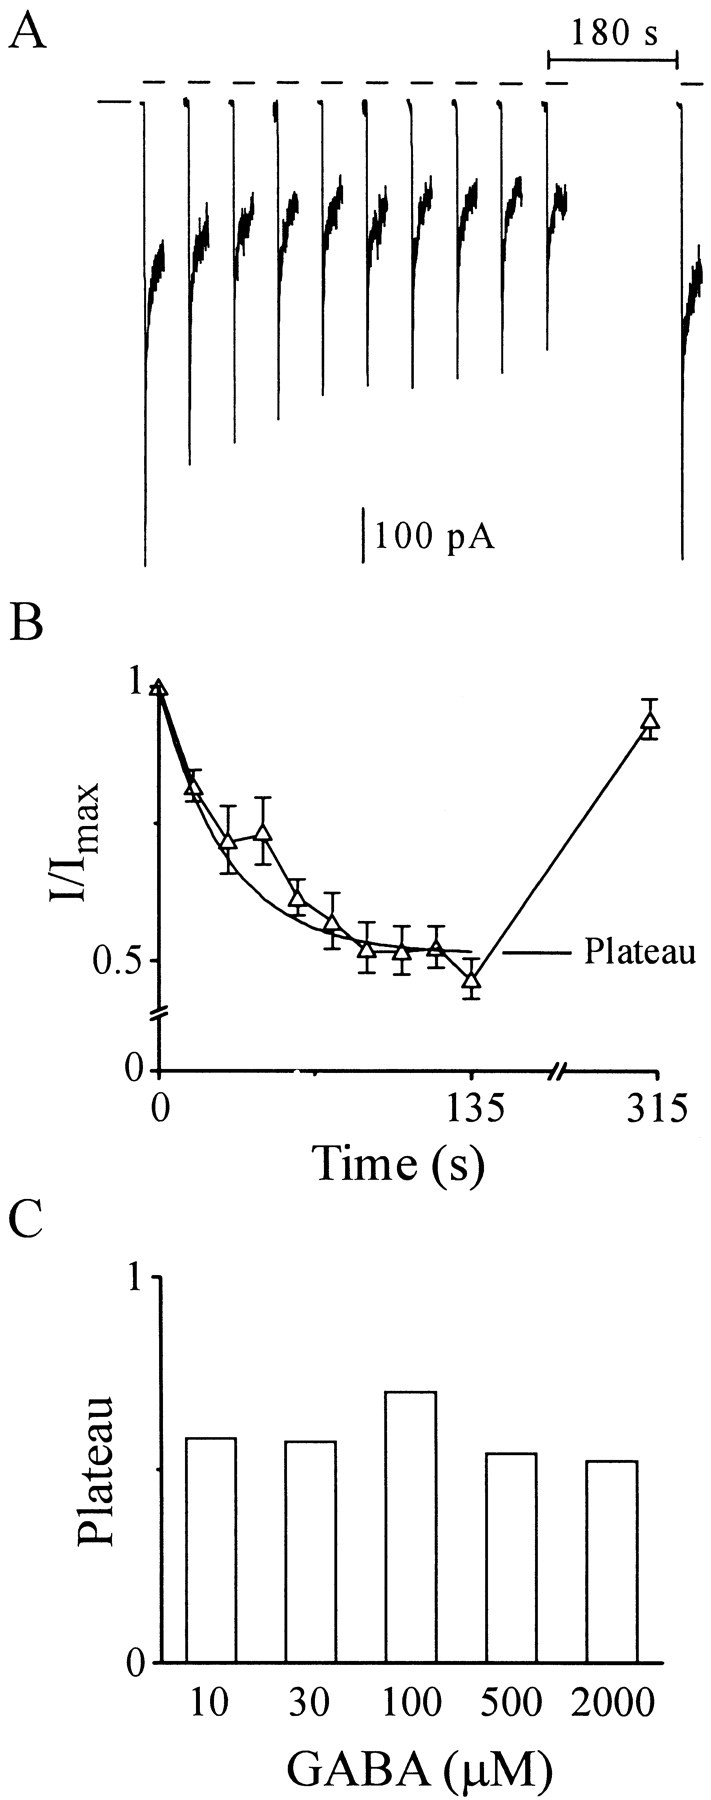
Peak amplitude of macropatch currents decreases during trains of GABA pulses. A, Macropatch currents triggered by GABA (2000 μm) pulses (100 msec) every 15 sec (series of short horizontal bars). Single long bar on left marks baseline. Deactivation time course has been truncated for clarity. B, Peak current amplitudes (I) fromA normalized to the amplitude of the first pulse (Imax) and plotted versus time of pulse (means ± SEM; n = 3). A monoexponential function fit is shown (smooth solid line) with a plateau of 0.52 (see Materials and Methods). C, Bar graph of plateau values derived from monoexponential fitting to macroscopic peak amplitude decrement for single-channel GABA pulse protocols (10 μm, 300 msec; 30 μm, 200 msec; and 100–2000 μm, 100 msec) with a period of 15 sec.