


Fig. 3.
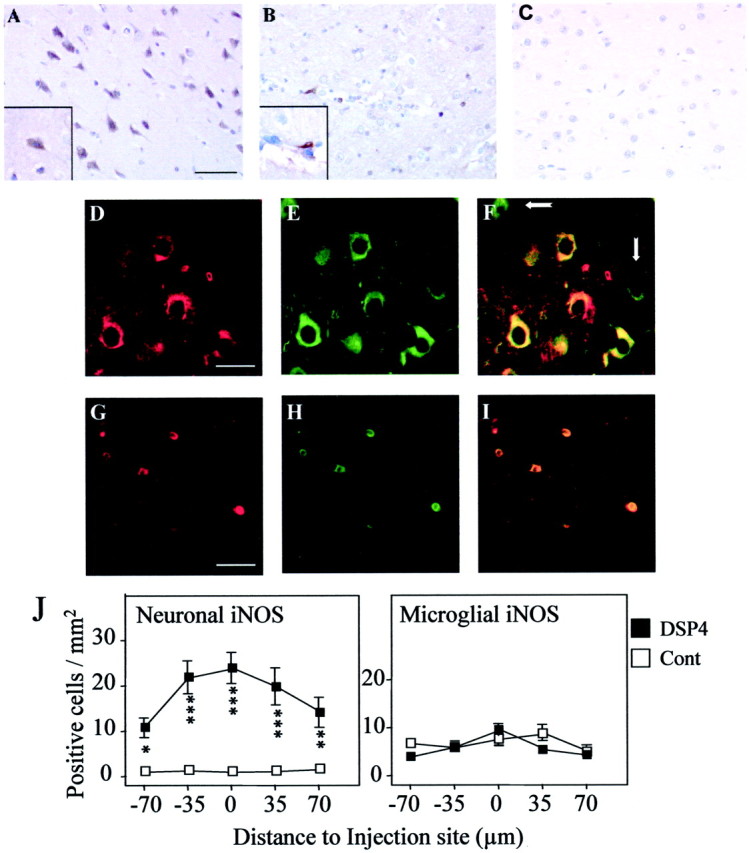
Immunohistochemical localization of iNOS. Serial sections were prepared from brains of DSP4-treated (A, C) and control (B) rats at 1 d after injection of Aβ (A, B) or saline (C) and stained with antibody to iNOS; immunoreactivity was detected by the DAB method. A, Theinset shows a positively stained cell with neuronal morphology. B, The inset shows a positively stained cell with microglial morphology. Cellular identification of iNOS staining was obtained by confocal laser microscopy of sections costained with antibodies to iNOS (D, G) and either NSE to detect neurons (E) or ED1 to detect microglial cells (H). F, I, Overlapping fluorescent signals; some NSE-positive, iNOS-negative neurons are indicated by white arrows. Scale bars: A, B, 50 μm; D–I, 25 μm. The images shown are representative of sections obtained from three different animals in each group. J, Staining was quantified by counting the number of neurons (left) and microglia (right) positively stained for iNOS in five serial sections. The data are the mean ± SEM of four animals in each group. *p < 0.05; **p < 0.005; ***p < 0.0005; DSP4-treated animals versus controls.