


Fig. 6.
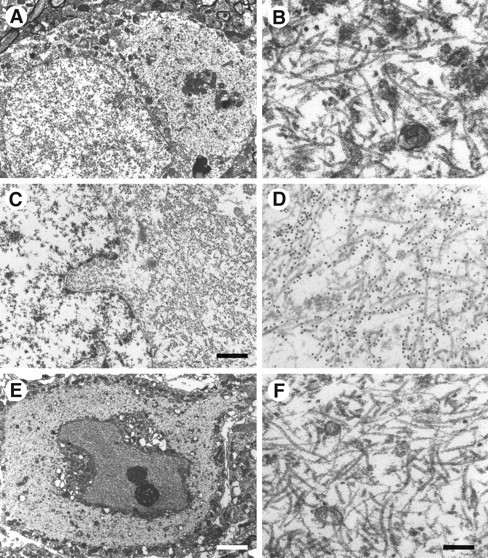
Electron microscopy and immunoelectron microscopy of nerve cells in brains and spinal cords from mice of the human P301S tau line. A, B, Cerebral cortex;C, D, brainstem; E,F, spinal cord. B, D,F, Higher magnifications of parts of the cytoplasmic regions from A, C, and E. Note the large numbers of abnormal filaments in the cytoplasm and apical dendrite. The electron micrographs in C andD show immunogold labeling of filaments using the phosphorylation-dependent anti-tau antibody AT8. Scale bars:C, 1.5 μm; E, 5.5 μm (forA, E); F, 300 nm (forB, D, F).