


Figure 2.
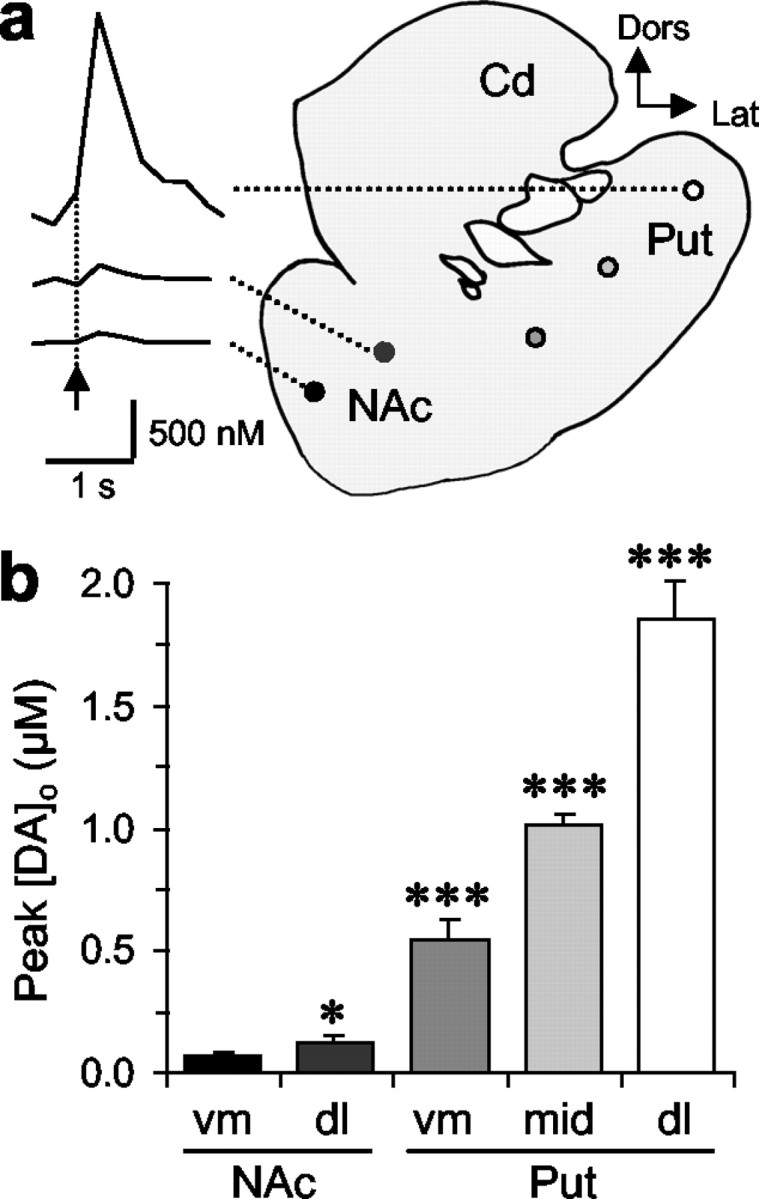
Availability of DA for release from ventral through dorsal striatum. a, Typical observations of [DA]o versus time after one stimulus pulse (arrow) in NAc versus dorsolateral putamen (Put) in coronal sections of marmoset striatum. Cd, Caudate; Dors, dorsal; Lat; lateral. Calibration for [DA]o: 500 nm, 1 sec. Filled circles are site-specific and indicate sites of recording for mean data, corresponding to the filled bar in b.b, Mean peak [DA]o ± SEM evoked at five loci indicated in a, along a ventromedial–dorsolateral axis. DA release varies between and within each region of the ventral and dorsal striatum (two-way ANOVA; p < 0.001). Post hoc comparisons with ventromedial NAc are illustrated (*p < 0.05; ***p < 0.001; n = 7–27).