


Figure 1.
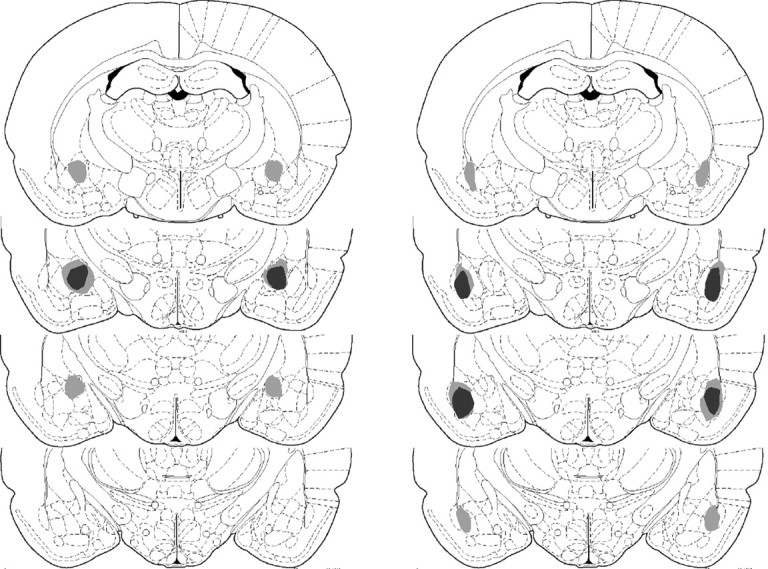
Schematic representation of excitotoxic lesions of the amygdala, with largest area of damage in light gray and smallest area of damage in dark gray. Lesions of the CN are displayed in the left column, and lesions of the BLA are displayed in the right column. Sections are from -1.88, -2.30, -2.80, and -3.30 mm relative to bregma, from top to bottom, respectively, in the anteroposterior plane (adapted from Paxinos and Watson, 1998).