


Figure 2.
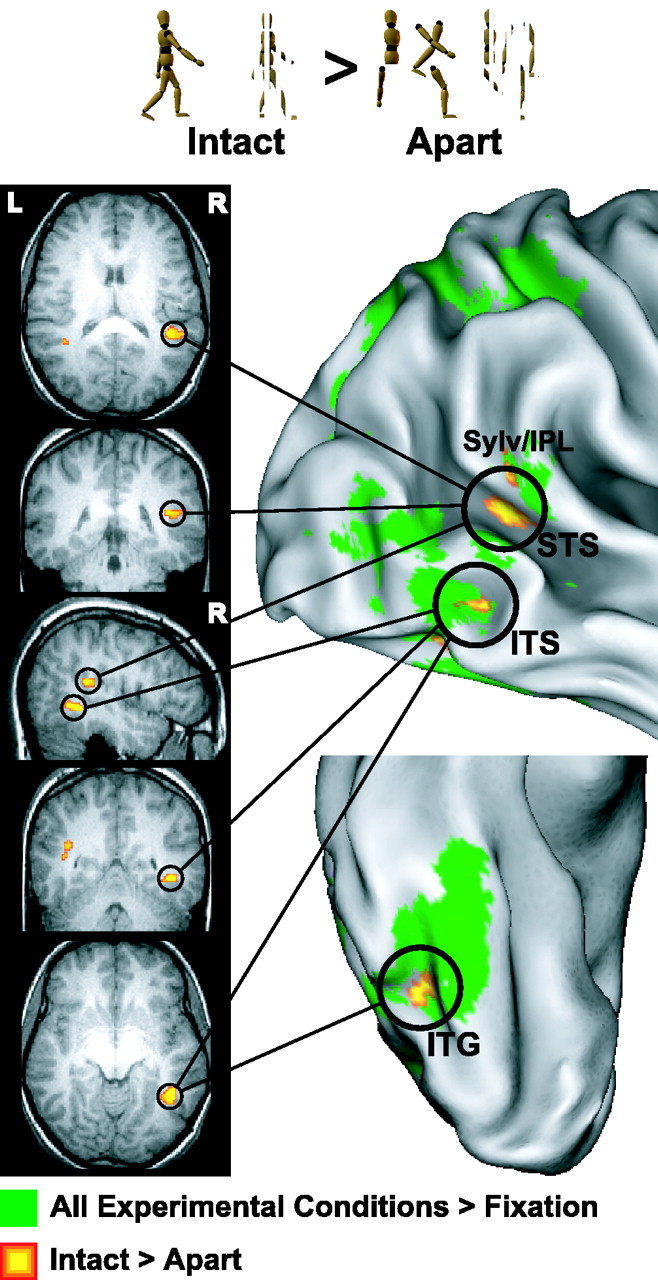
Experiment 1: intact versus apart walker. Group analysis activation data overlaid on a right lateral and a right ventral view of the inflated Colin brain atlas anatomical image (right) and a single subject's normalized SPGR anatomical image (insets at left). Warm colors depict voxels where activation was significantly greater for intact versus apart. Green depicts voxels that activated significantly to all experimental conditions from experiments 1 or 2 versus fixation baseline. ITG, Inferior temporal gyrus; Sylv/IPL, Sylvian/inferior parietal lobule; L, left; R, right.