


Figure 1. A MyD88-TBK1 Pathway Commonly Promotes TLR-inducibie Glycolysis.
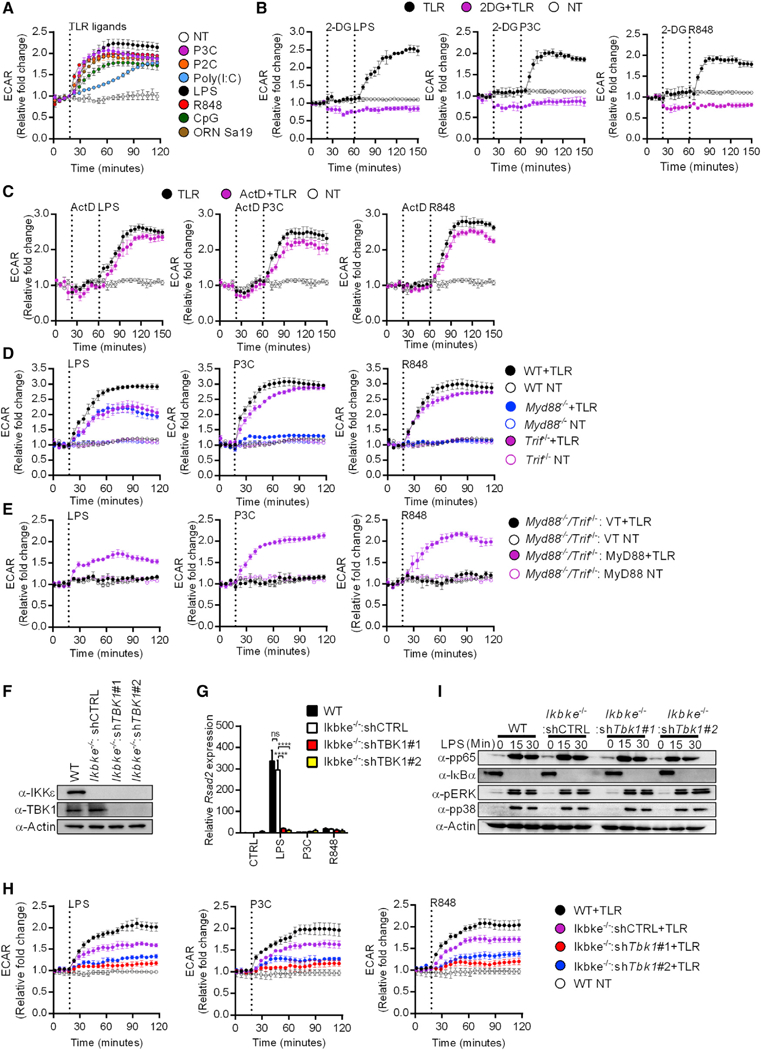
(A) TLR induced changes in the ECAR of primary BMDMs stimulated with the TLR ligands indicated or left untreated (NT) were measured by the Seahorse assay. Data represent mean ± SEM of triplicate wells. Shown is one representative out of 3 independent experiments.
(B) Same as (A) except stimulations were performed with or without 2-DG or left untreated (NT), as indicated.
(C) Same as (A) except stimulations were performed with or without actinomycin D (ActD) or left untreated (NT), as indicated.
(D) Same as (A) except stimulations were performed on primary BMDMs of the genotypes indicated.
(E) Same as (A) except stimulations were performed on Myd88−/−/Trif−/− iBMDMs expressing MyD88 or an empty vector (VT).
(F) Expression levels of TBK1 and IKKε were determined by western analysis in lysates from the indicated iBMDMs.
(G) Indicated iBMDM lines were stimulated as indicated and Rsad2 expression was measured by qPCR.
(H) Same as (A) except stimulations were performed on iBMDMs of the genotypes indicated or left untreated (NT).
(I) Indicated iBMDM lines were pre-treated with cycloheximide and treated with LPS for the times indicated. Western analysis of lysates examined activation of NF-κB (pp65, IκBα) and MAP kinase (pp38, pERK) pathways.
Each panel is a representative experiment of at least 3 independent repeats.
See also Figure S1.