


Figure 3.
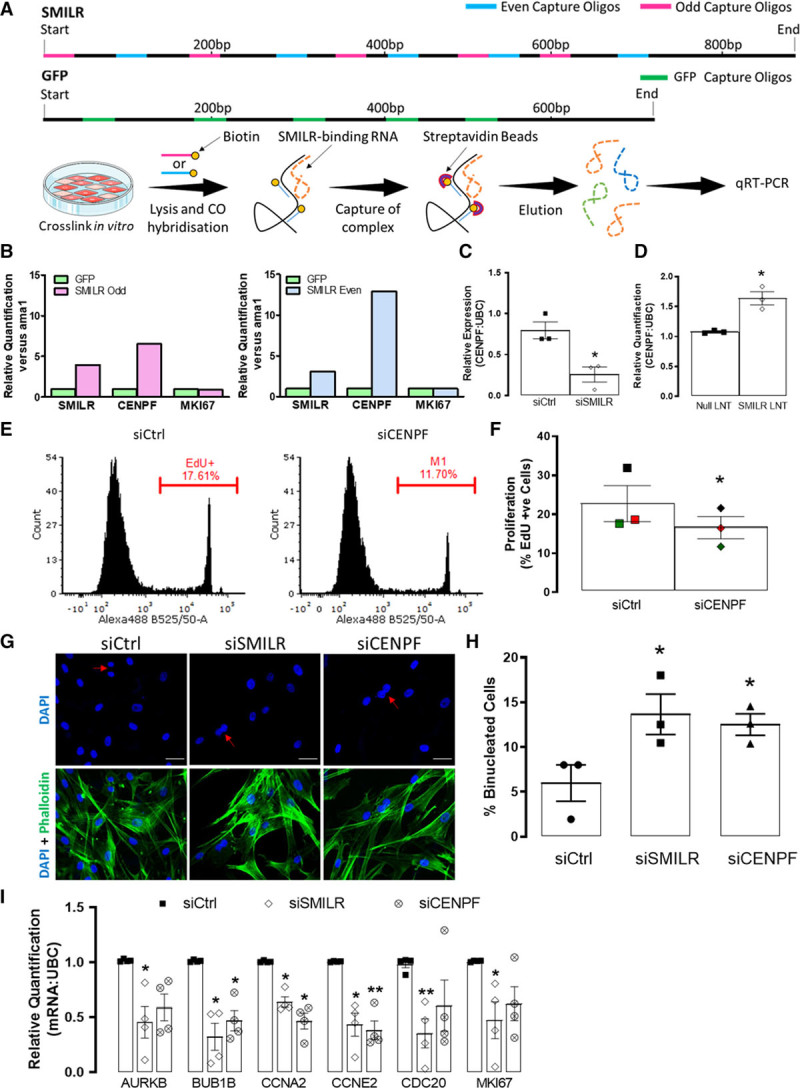
RNA: RNA analysis reveal a SMILR: CENPF (centromere protein F) interaction. A, Schematic of DNA antisense biotinylated probes site for SMILR and GFP and the experimental design of RNA: RNA pulldowns. B, Bar charts representing relative enrichments of SMILR, CENPF, and MKI67 (marker of proliferation Ki-67) in SMILR-even and -odd pulldowns vs the GFP (green fluorescent protein) control pulldown. Each even and odd SMILR probe pulldown was performed once across 2 independent biological replicates. Effects of (C) SMILR knockdown and (D) SMILR overexpression on CENPF mRNA. **P<0.05 Iman and Conover nonparametric ranked analysis followed by Student t test, n=3 biological replicates. E, Representative fluorescence-activated cell sorter (FACS) histogram plots depicting EdU uptake in siCtrl and siCENPF treated humans saphenous vein derived smooth muscle cells (HSVSMCs). Gate represents EdU+ cells. F, Bar chart showing mean changes of EdU incorporation in siCtrl and siCENPF treated HSVSMCs. (Continued )Figure 3 Continued. Iman and Conover ranked nonparametric analysis followed by t test, n=3 biological replicates. *P<0.05. G, Fluorescent images of HSVSMCs stained with DAPI (4′,6-diamidino-2-phenylindole) and phalloidin. Scale bar represents 50 µm. Red arrows indicate binucleated cells. H, Bar chart representing the % of total cells that were binucleated. Iman and Conover ranked nonparametric analysis followed by Student t test *P<0.05 vs siCtrl, n=3 biological replicates. I, The effects of CENPF knockdown on mitotic associated genes compared to effects observed with knockdown of SMILR, *P<0.05, by Iman and Conover ranked nonparametric analysis followed by paired t test, n=4 biological replicates.