


Figure 7.
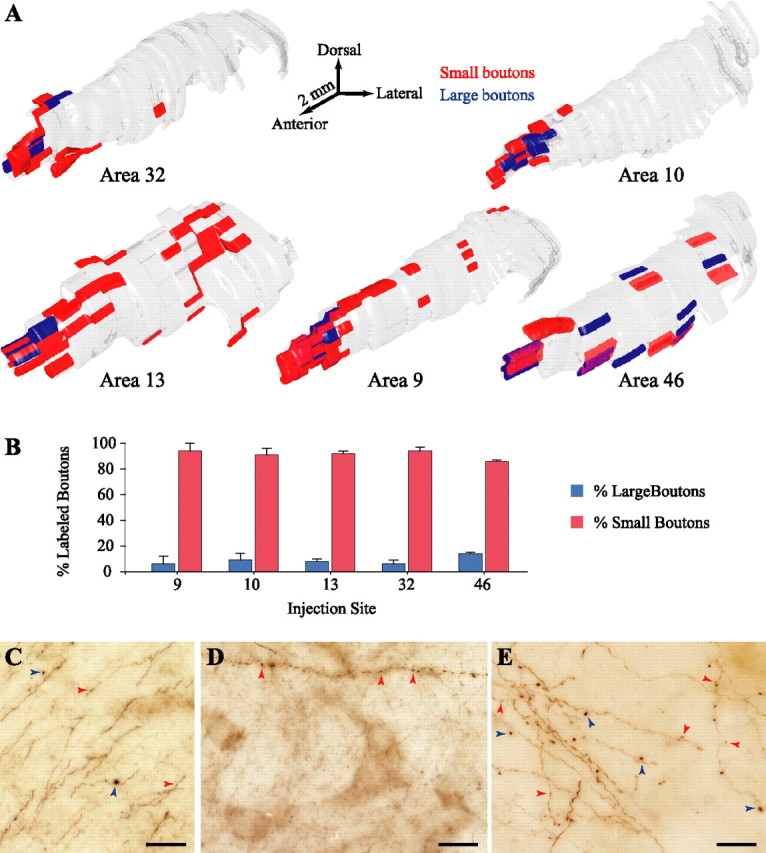
Large and small bouton populations in TRN. A, 3D reconstruction of the topographical distribution of large (blue) and small (red) boutons in TRN from prefrontal axons. B, Normalized density (percentage) of large and small boutons in TRN from prefrontal axons. C–E, BDA-labeled fibers from prefrontal cortices containing only large (blue arrowheads), only small (red arrowheads), or both kinds of boutons in TRN. Scale bars, 25 μm.