


Figure 3.
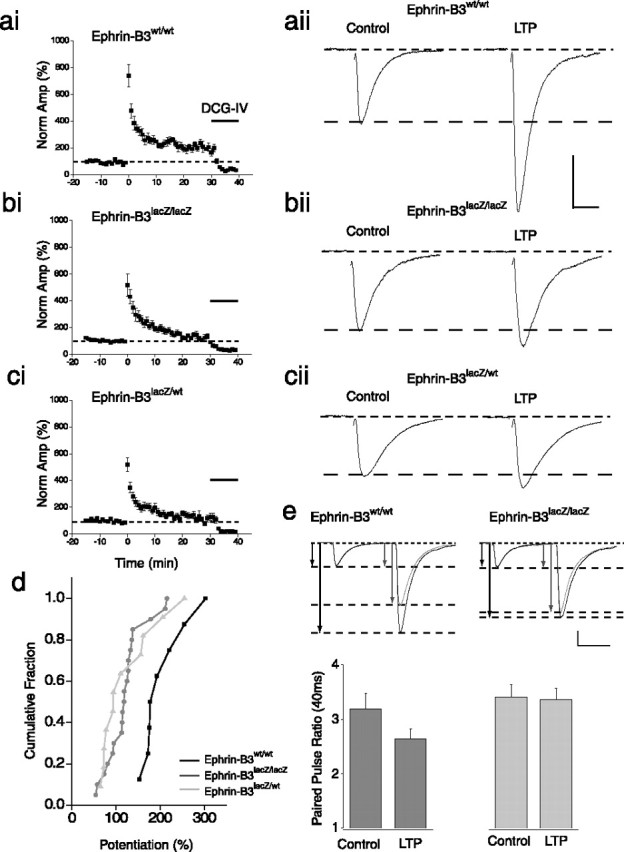
Mossy fiber LTP is disrupted in ephrin-B3lacZ/lacZ mice. ai, Averaged time course of mossy fiber LTP for all recordings from ephrin-B3wt/wt mice. Magnitude of LTP was calculated as the percentage increase in the size of the mossy fiber EPSC 20–30 min after the tetanus compared with 15 min control period before induction. Black bar represents application of group II mGluR agonist at the end of each experiment. aii, Representative EPSC traces from one experiment in ephrin-B3wt/wt mice before and after the induction of LTP Calibration: 10 ms, 200 pA. bi, Averaged time course of mossy fiber LTP in ephrin-B3lacZ/lacZ mice. bii, Representative EPSC traces from one experiment during control and 20–30 min after tetanic stimulation. ci, cii, Averaged time course of mossy fiber LTP and representative EPSC traces from ephrin-B3lacZ/wt mice. d, Cumulative probability distribution of mossy fiber LTP measured as the percentage potentiation 25–30 min after tetanus compared with control period. LTP in ephrin-B3lacZ/lacZ and heterozygous littermates was significantly lower than in wild-type littermate controls. e, Paired-pulse ratio measured at an interstimulus interval of 40 ms is reduced after LTP in wild-type mice signifying an increase in release probability of the synapse. Top panel shows representative traces from ephrin-B3wt/wt and ephrin-B3lacZ/lacZ before and after LTP. The traces are scaled to the first EPSC in the pair to highlight the paired-pulse ratio. Calibration: 50 ms, 200 pA; 50 ms, 510 pA for ephrin-B3wt/wt after LTP. Bottom panel summarized paired-pulse data for all recordings. A significant change in paired-pulse ratio is observed after LTP in ephrin-B3wt/wt mice but no change in recordings from ephrin-B3lacZ/lacZ mice.