


Figure 3.
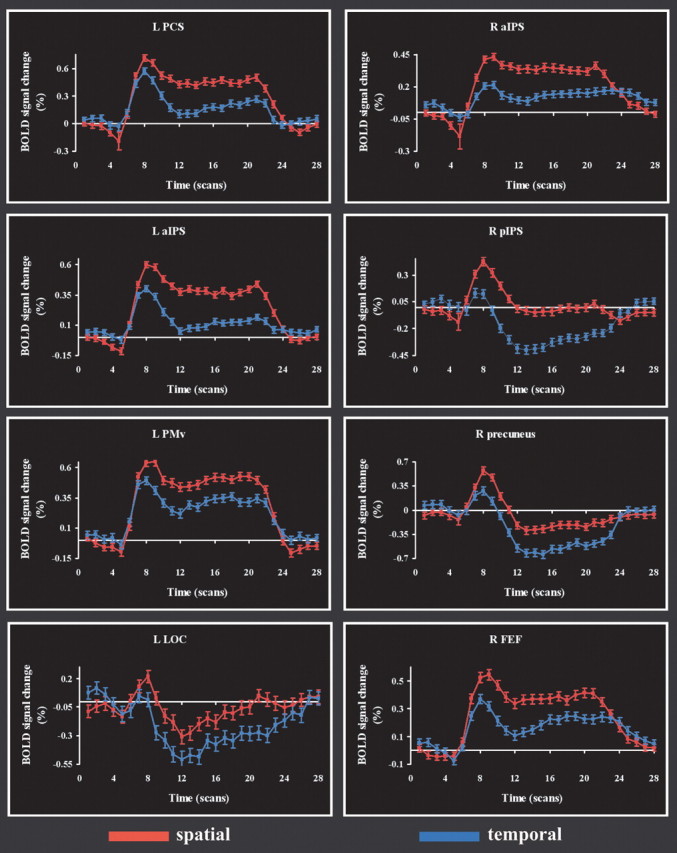
Time courses of BOLD signal change in representative regions that were more active on the spatial task than the temporal task. Abbreviations as in Figure 2. The horizontal (time) axis is calibrated in terms of scan number (TR, 1.5 s). R, Right; L, left.