


Figure 1.
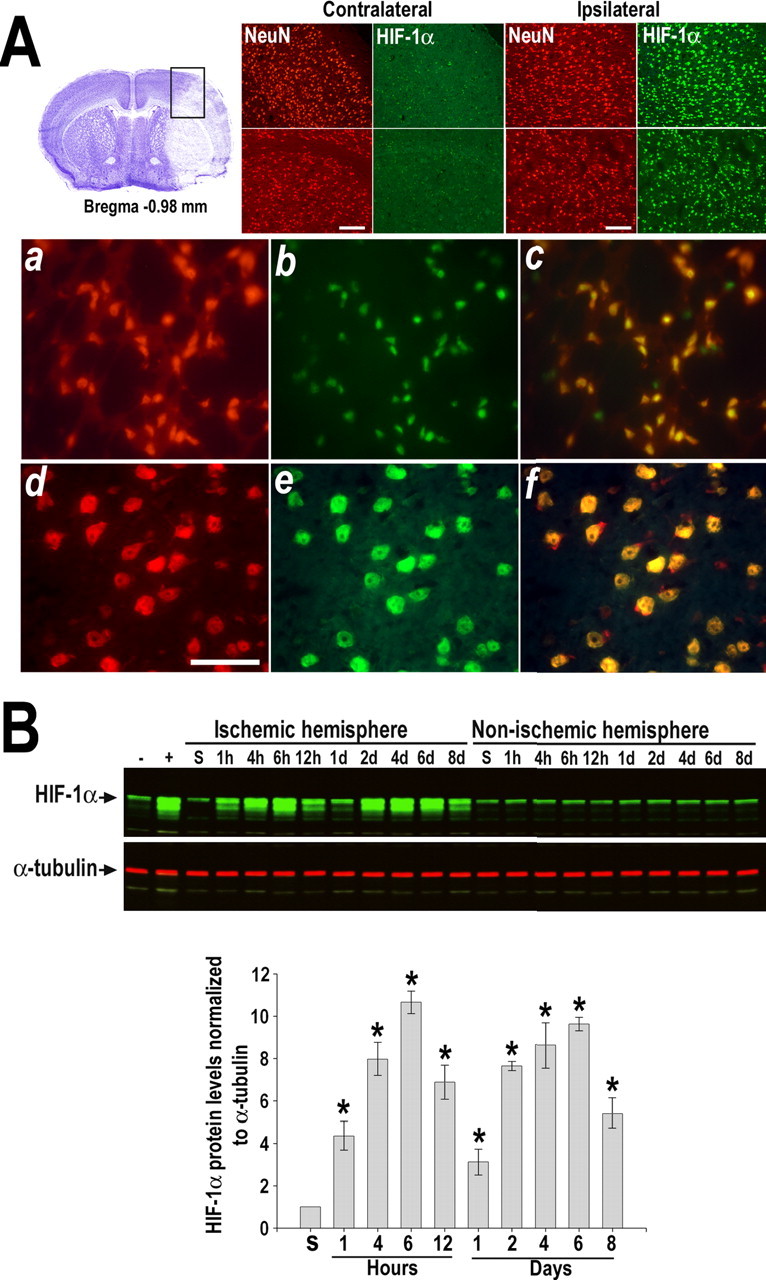
HIF-1α induction in the mouse brain after transient ischemia. A, Double immunostaining of HIF-1α (green) and NeuN (red) at 6 h of recovery from MCAo. Boxed area in cresyl violet-stained section indicates the area in which representative photomicrographs were taken. Top panels show images from cortex and striatum of non-ischemic and ischemic hemispheres. Scale bars, 20 μm. Bottom panels show higher-magnification views of neurons expressing HIF-1α that are located in the infarct area (a–c) and surrounding tissue (d–f). Scale bar, 50 μm. Merged images are shown in yellow. B, Western blot analysis of HIF-1α in tissue lysates from non-ischemic and ischemic hemisphere of mice subjected to MCAo followed by recovery (1 h to 8 d). Codetection of α-tubulin was performed to assess equal loading. Nuclear extracts from normoxic and hypoxic cells were used as positive (+) and negative (−) controls, respectively. Protein bands were quantified, and the value obtained from sham-operated control (S) was arbitrarily defined as 1. Graph shows data acquired from four independent experiments. *p ≤ 0.05 compared with sham.