


Figure 1.
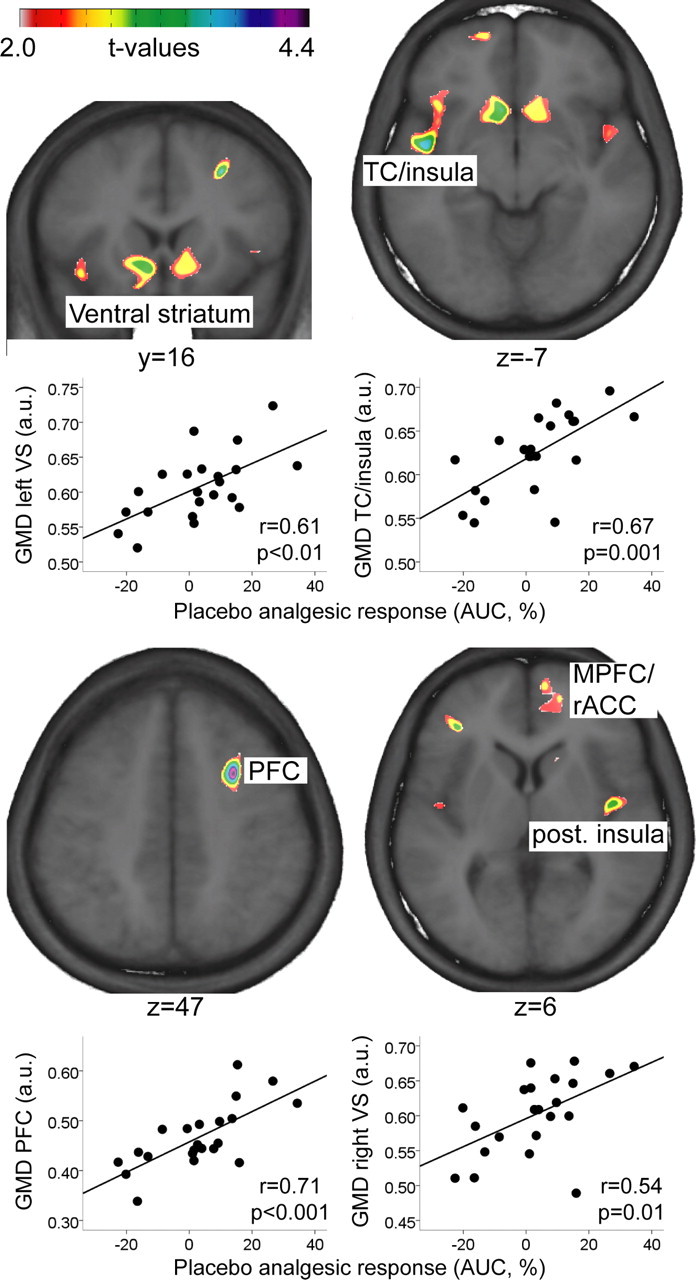
Areas in which the magnitude of placebo analgesia correlated with gray matter density. Please note that the clusters in the MPFC/rACC and posterior insula did not reach statistical significance. Scatter plots depict the relationships between mean GMD in the significant clusters and placebo analgesic response (positive values correspond to decreased pain ratings in placebo compared with control condition). Images in neurological convention. TC, Temporal cortex; (M)PFC, (medial) prefrontal cortex; rACC, rostral anterior cingulate cortex; a.u., arbitrary units; AUC, area under the curve; GMD, gray matter density).