


Figure 7.
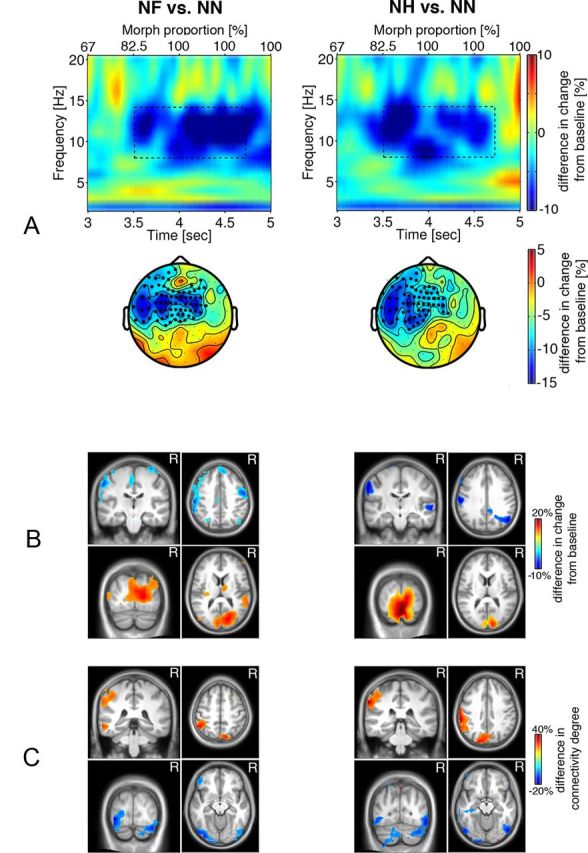
A, Difference in time-frequency representations of power in the later recognition stage for the NF > NN and NH > NN contrasts averaged across sensors of significant clusters (marked by * in the corresponding scalp topographic plots, p < 0.05). Axes as in Figure 3. Dashed rectangles indicate time-frequency windows of significant condition differences, 8–14 Hz during 3.5–4.7 s after stimulus onset. B, Source reconstruction of the difference in α power modulation illustrated in A. Warm colors indicate group differences in α power increase, and cold colors indicate group differences in α power decrease (MNI coordinates: postcentral gyrus, −59, −26, 51]; precentral gyrus, 50, −9, 51; cuneus, 12, −92, 9). C, Brain regions exhibiting group differences in connectivity for the NF versus NN and NH versus NN contrasts thresholded at 80% of maximum. Cold colors indicate group differences in decoupling, whereas warm colors indicate group differences in increased connectivity to other brain regions for the emotional relative to neutral faces (MNI coordinates: postcentral gyrus, −52, −33, 50; precuneus, −8, −77, 43; precuneus, 9, −82, 43; inferior occipital gyrus, −35, −88, −12; inferior occipital gyrus, 36, −85, −12).