


Figure 3.
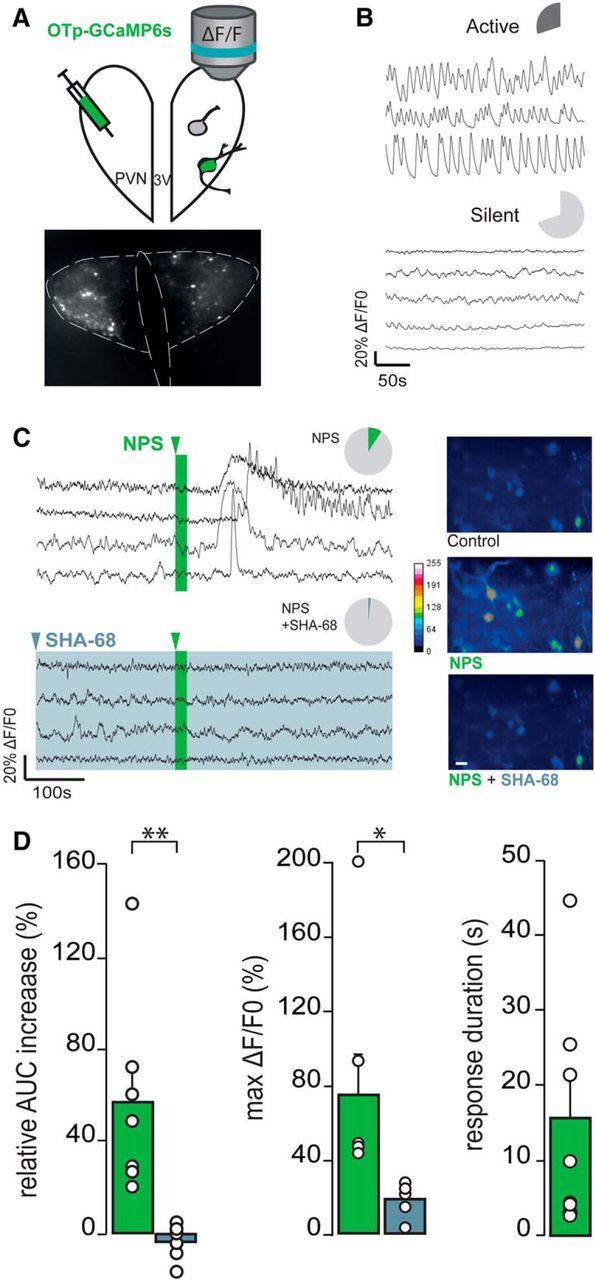
NPS effects on PVN-OXT neurons in hypothalamic slice preparation (A–D). A, Schematic drawing of the PVN OXTpr-GCaMP6s virus infusion and subsequent [Ca2+]i imaging of OXT neurons. B, Basal activity of two distinct subpopulations of OXT neurons (dark gray represents active; light gray represents silent) illustrated by typical ΔF/F0 traces. Pie charts represent the proportion of active (up) and silent (down) OXT neurons: n slices (ns) = 11, n OXT neurons (nn) = 237. C, Pie charts of the proportion of responsive OXT neurons to NPS application alone (2 μm, 20 s; ns = 11, nn = 24 of 237; green) or in the presence of NPSR antagonist (SHA-68 100 μm, >15 min; ns = 6, nn = 3 of 135; light blue) and typical ΔF/F0 traces. Pseudo-color video extract of identified OXT neurons through GCaMP6s imaging [Ca2+]i in control conditions (gray), in the presence of NPS (green) or NPS + SHA-68 (light blue) (stacks of 50 images/10 s of recording). Scale bar, 20 μm. D, Relative AUC increase and maximal ΔF/F0 of OXT neurons in the presence of NPS (ns = 11; green) or NPS + SHA-68 (ns = 6, light blue). Only response duration of OXT neurons in the presence of NPS (ns = 11; green) are represented here. White circles represent the average value per slice. *p < 0.05 (Student's t test). **p < 0.01 (Student's t test).