


Fig. 6.
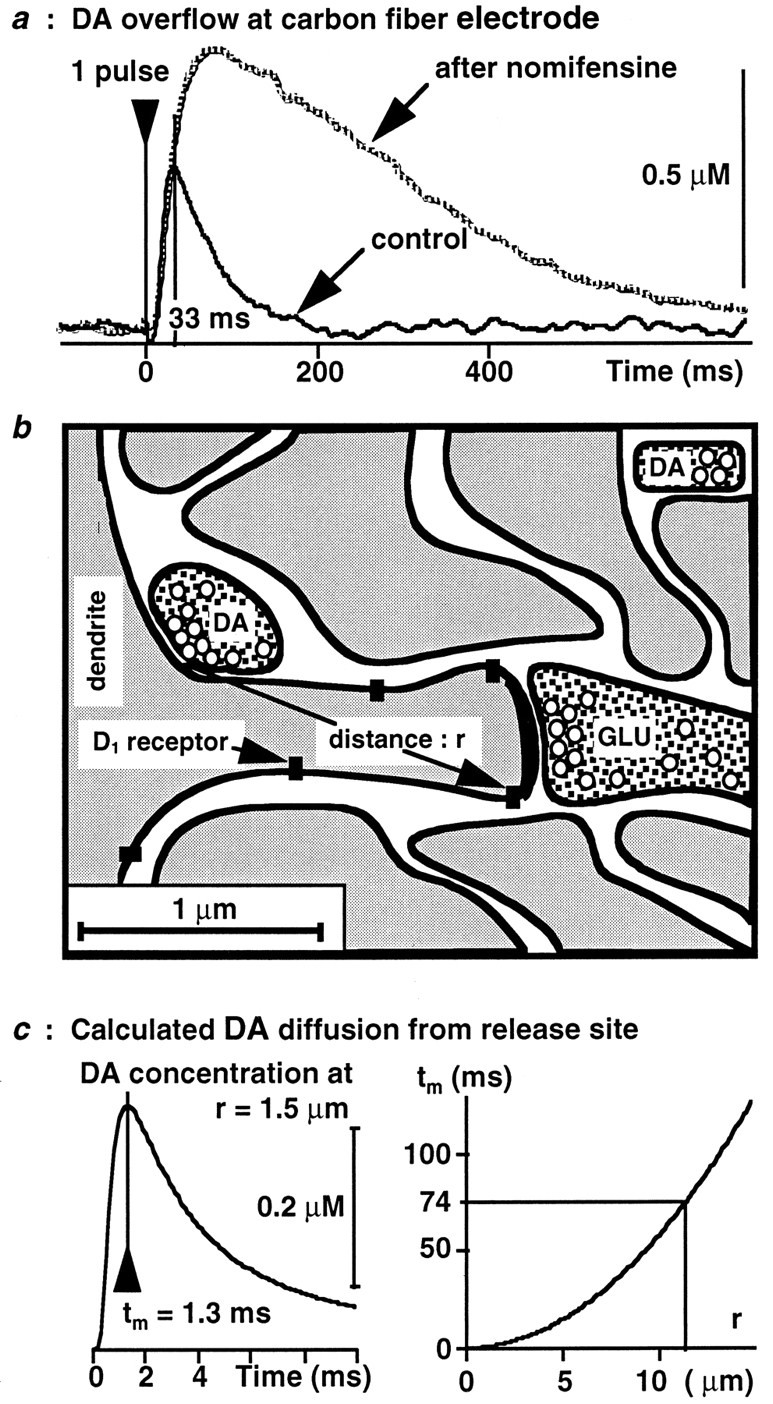
Kinetics of DA diffusion in the extracellular space. a, Single pulse stimulation of the MFB was applied every 15 sec for 45 min. The DA uptake inhibitor nomifensine (20 mg/kg, s.c.) was administered 15 min after the first stimulation. The resulting DA overflow was electrochemically recorded and averaged by groups of 20 consecutive stimulations. The figure shows the averaged DA overflow recorded before drug administration and that recorded 20 min after, i.e., when the drug effect is maximal (Suaud-Chagny et al., 1995). b, This drawing summarizes morphological data concerning the localization of D1 dopaminergic receptors (Levey et al., 1993; Caillé et al., 1996). Notice that synaptic clefts represent a minute fraction of the whole extracellular space that occupies 21% of the brain volume (Nicholson, 1985, 1995). c, Theleft curve represents the DA concentration at a receptor site resulting from the exocytosis of only one DA vesicle in a release site located at a distance r. The DA concentration reaches its maximum at a time tm, which depends on the square of the distance (right curve).