


Figure 5. Dense foci of mTOR complex 1 in GCs.
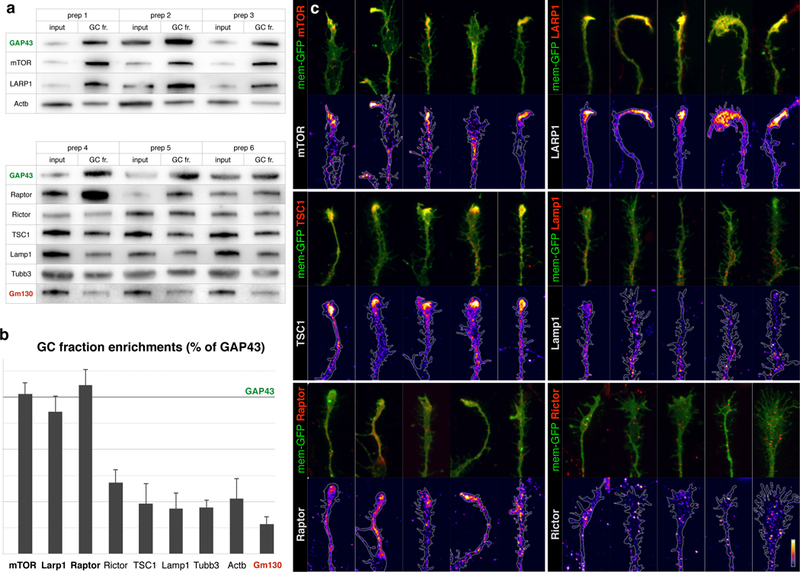
a, Biochemical analysis of GC enrichment of mTOR pathway proteins and controls, shown in triplicate western blots of homogenate (input) and GC fraction (GC fr.) pairs, derived from six independent preps. GC marker GAP43 is positive control for enrichment, Golgi marker Gm130 is negative control. b, Quantification of GC enrichment blots in a expressed as ratios of GC fr. signal over input signal, normalized to the corresponding GAP43 ratio (marked by horizontal line). Error bars indicate SEM, n≥3 litters. TSC1, Rictor, and Lamp1 are present in GCs comparable to actin and tubulin, while mTOR, LARP1, and Raptor display high GC enrichment comparable to GC marker GAP43. c, Closeups of GCs from callosal projection neurons immunostained for endogenous mTOR pathway proteins (red in overlays, heat mapped in underlying panels). Five example GCs are shown per sample to capture the representative range. Neurons were labeled via in utero electroporation at E15 with membrane-GFP (green in overlays, outlined in underlying panels), cultured at P0, fixed and stained at DIV 3. mTOR, LARP1, TSC1, and Raptor (mTORC1 marker) appear in dense local foci within GCs. Rictor (mTORC2 marker) and Lamp1 (lysosome marker) appear in fine granules distinct from GC foci. Bar (lower right) indicates heat-map color range, as well as 10 µm scale.