


Fig. 1. MRE basics, experimental setup, and MRE data.
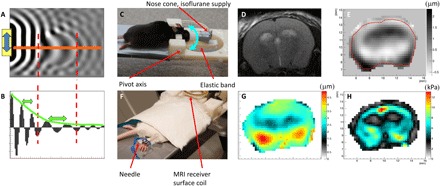
(A) 2D numerical simulation example of shear wave displacement field. (B) Plot of displacement along the orange line in (A) shows an increase in wavelength in the stiff ellipsoidal inclusion and attenuation of the wave due to frictional forces in the medium. (C) Head rocking MRE system adapted to the mouse. The cyan double-arrow indicates the pivoting direction of the movable front part. (D) T2-weighted anatomical image, (E) measured displacement field in through-slice direction at one time point (μm), (F) placement of electrical stimulation needles in the hind limb, (G) total induced displacement amplitude (μm), and (H) resulting real part of the complex shear modulus after the reconstruction process. The photographs used in Fig. 1 (C and F) are provided courtesy of N. Nazari, Boston University, and S. Patz, Brigham and Women’s Hospital, respectively.