


Figure 4:
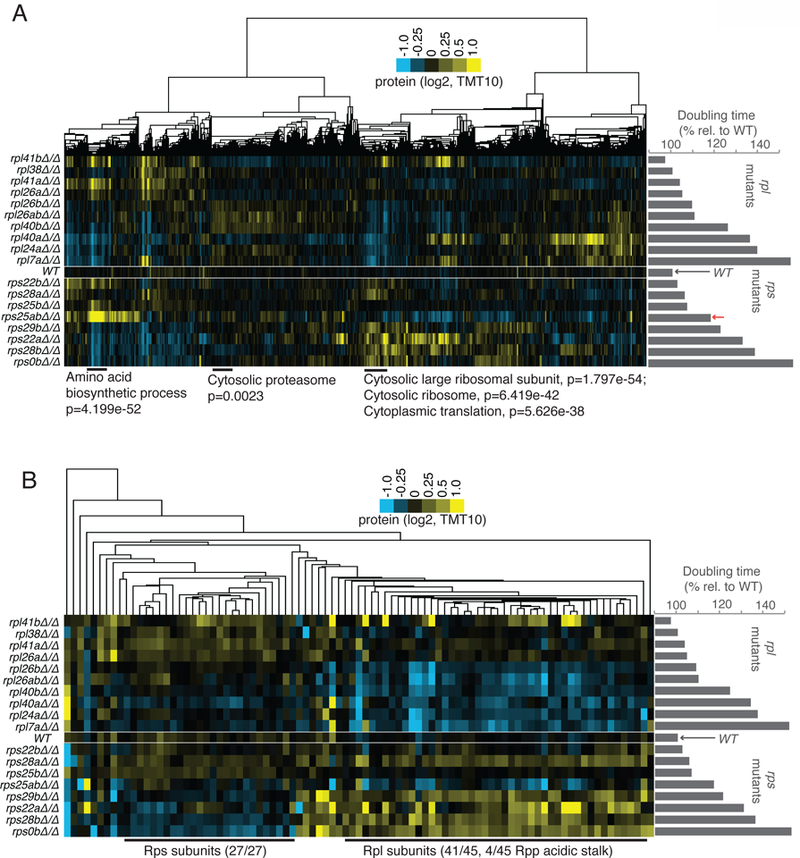
Protein levels in rpl and rps mutants generally match expectations based on translation patterns, but rpl mutants degrade all other RPs, while rps mutants only degrade other Rps subunits. See also Fig. S2, S4, S5, File S4. A) TMT-based mass spectrometry was performed on matched extract from experiment shown in Fig. 2A. Genes (columns) are clustered according to similar protein abundance patterns across all mutants. Red arrow indicates the position of rps25aΔrps25bΔ. GO terms and H-B-based p-values enriched in discrete clusters are labeled blow plot. Columns are normalized to allow comparison. Note similarity to translation data (Fig. 2, S5D). B) Data for RP-encoding genes only was isolated from dataset presented in A). Note that large cluster at the left contains only Rps subunits, the large cluster at right contains only Rpl and Rpp (60S acidic stalk) subunits.