


Figure5:
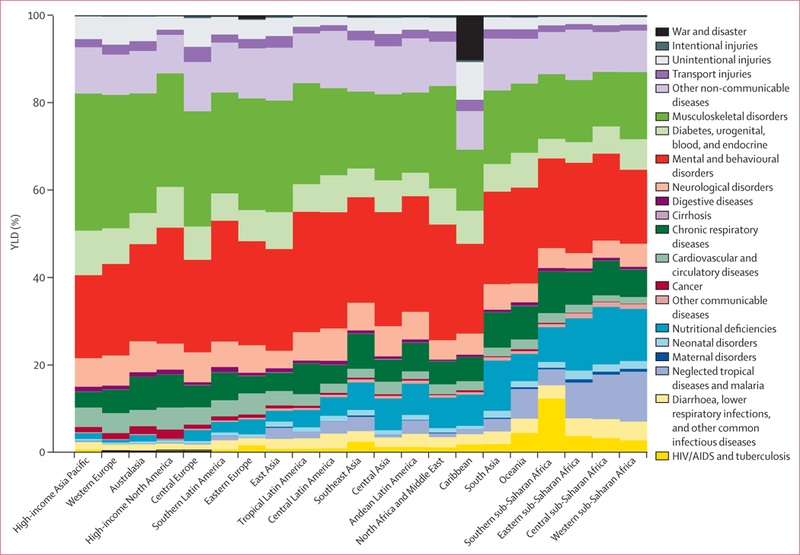
Percentage of years lived with disability (YLDs) by 21 major cause groupings and region for 2010 An interactive version of this figure is available online at http://healthmetricsandevaluation.org/gbd/visualizations/regional.
Official websites use .gov
A
.gov website belongs to an official
government organization in the United States.
Secure .gov websites use HTTPS
A lock (
) or https:// means you've safely
connected to the .gov website. Share sensitive
information only on official, secure websites.
Percentage of years lived with disability (YLDs) by 21 major cause groupings and region for 2010 An interactive version of this figure is available online at http://healthmetricsandevaluation.org/gbd/visualizations/regional.