


Figure 5.
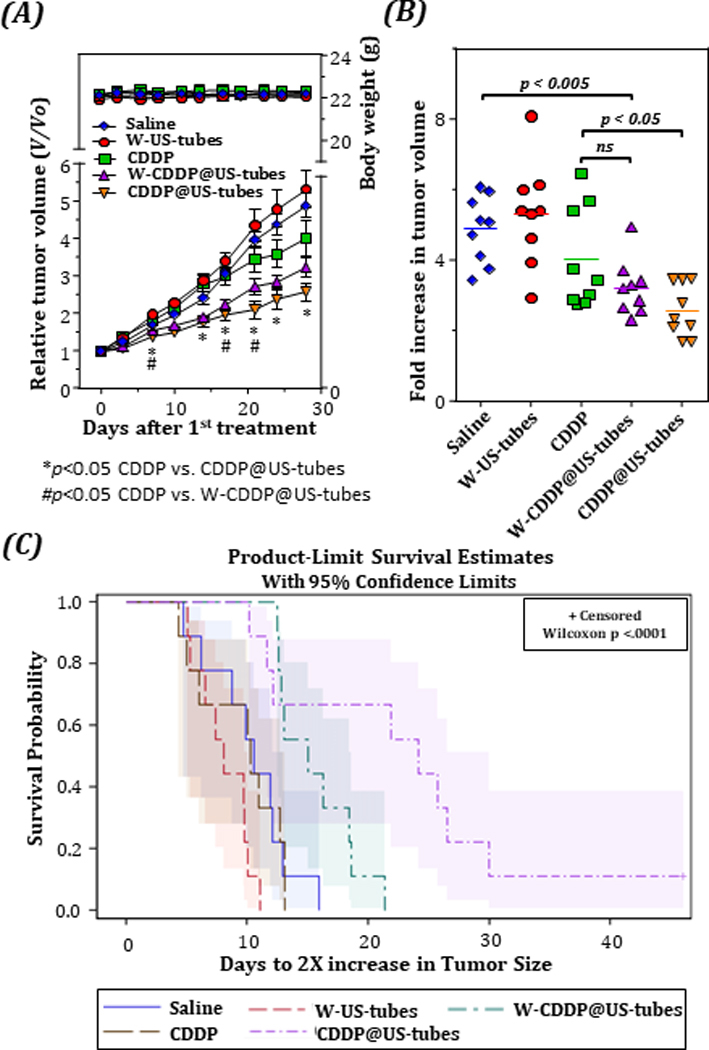
Suppression of tumor growth by intraperitoneal injection of CDDP@US-tubes to an Patient-derived, 4272 transplant, xenograft. (A), Tumor growth of Patient-derived tumor-bearing mice after receiving different treatments as indicated. (*p < 0.05 CDDP@US-tubes vs. CDDP, #p < 0.05 W-CDDP@US-tubes vs. CDDP, unpaired, two-sided t-test, n=9; error bars= s.e.) The mean body weight changes is also plotted in A. Fold increase in tumor volume (B) and Kaplan-Meier survival curves (C) depicting the tumor doubling times for different treatment groups.