


FIGURE 3.
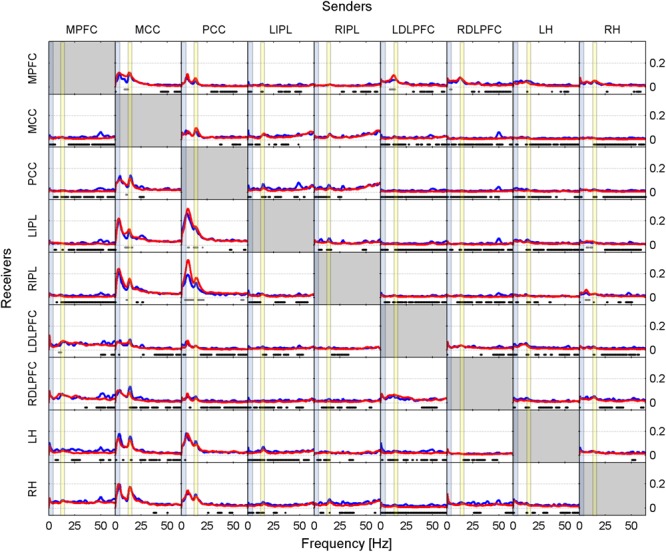
Effective connectivity assessed by iCOH after the SOn transition in baseline (blue curves) and recovery (red curves). For details of the representation see Figure 1. Dots below the curves indicate significant differences between iCOH after SOn in baseline vs. iCOH after SOn in recovery: gray dots iCOH recovery > iCOH baseline; black dots iCOH recovery < iCOH baseline. To facilitate orientation, the delta (0.5–5 Hz)) and sigma (12–16 Hz) band have been highlighted by light blue and light yellow, respectively.