


Figure 4 – Accumulation of paused RNAPII in OCCC cells depends on ARID1A.
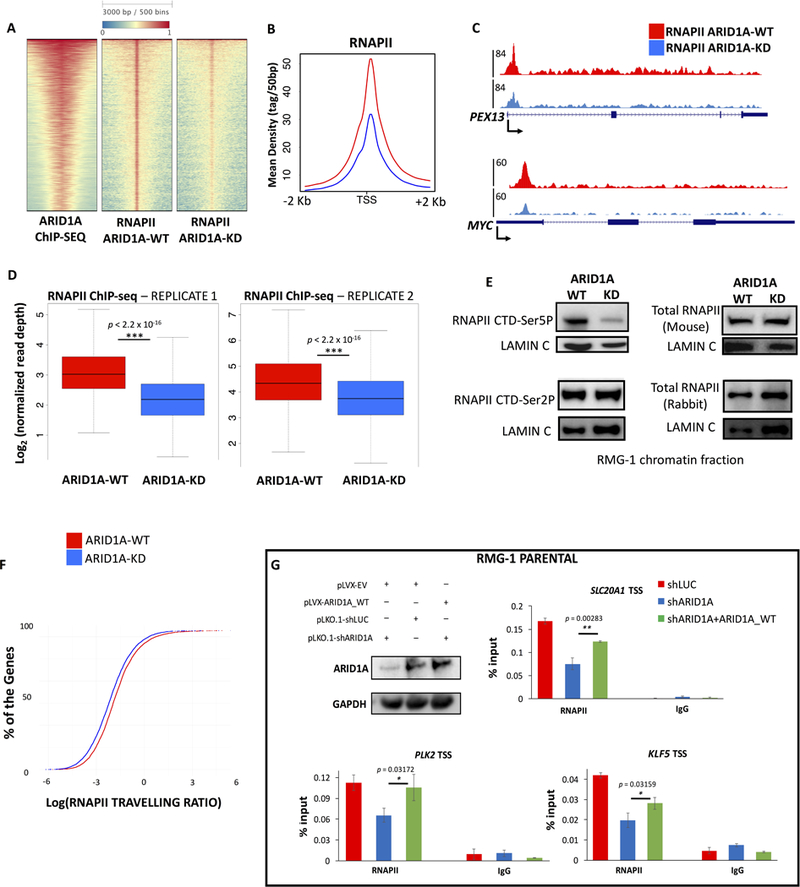
(A) ARID1A depletion (ARID1A-KD) affects RNAPII levels at the majority of active TSS. The heatmap shows 5,914 TSS targeted by SWI/SNF, ranked by mean intensity of ARID1A. (B) Average profiles of RNAPII ChIP-seq (ARID1A-WT, KD) around the TSS of 5,914 genes presented in panel (A). (C) UCSC Genome Browser screenshot of RNAPII ChIP-seq profiles (ARID1A-WT, KD) at PEX13 and MYC loci. There is a significant reduction of RNAPII occupancy at the promoter proximal regions. (D) Box plots showing read depth of RNAPII ChIP-seq at the TSS of ARID1A target genes. RNAPII occupancy is significantly reduced (p<2.2×10⁻¹⁶) after depletion of ARID1A, in two independent replicates. (E) Immunoblot analysis of the chromatin fraction of OCCC cells, before and after ARID1A depletion. While total RNAPII levels (assayed with two different antibodies, see methods) and phosphorylation of Ser2 remain unchanged, phosphorylation of Ser5 is reduced. Lamin C is shown as loading control. Quantitative immunoblots are shown in Supplemental Fig. S3B. (F) Travelling ratio analysis reveals changes in RNAPII occupancy at proximal promoter vs. gene body. Incremental plots demonstrate that ARID1A depletion elicits a reduction of pausing genome-wide. (G) Parental RMG-1 cells were infected with shRNAs against ARID1A and rescued with exogenously expressed full-length ARID1A. Quantitative PCR at three candidate genes shows that downregulation of RNAPII at TSS is significantly reversed (n=3) by ARID1A overexpression.