


Extended Data Figure 1 |. Consistency of cell capture and identification in surgical EthSin scRNA-seq patient cohort.
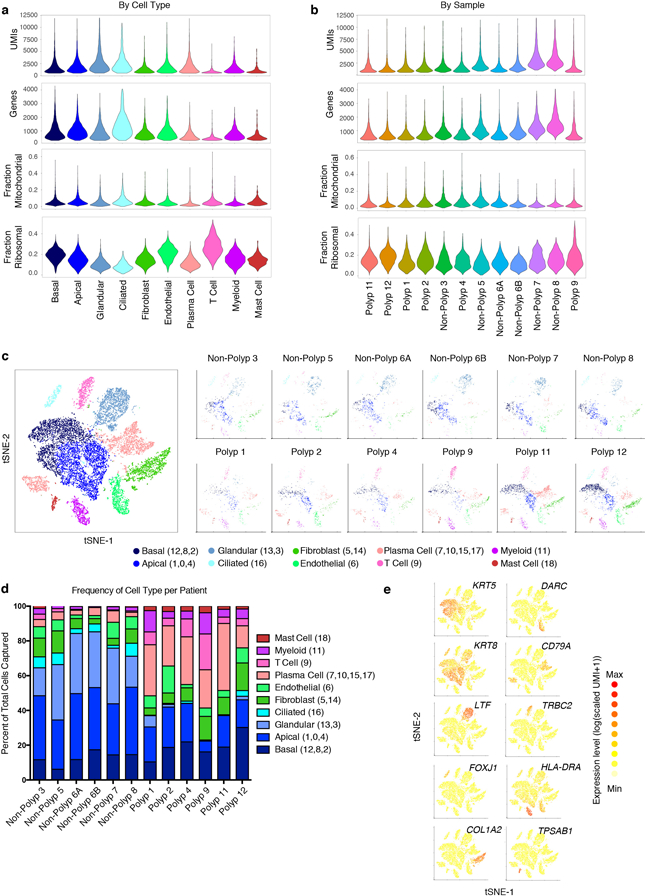
(a) Number of unique molecular identifiers (nUMI) and genes identified, and fraction of reads mapping to mitochondrial or ribosomal genes across recovered cell types; 3,222 basal cells, 4,362 apical cells, 2,192 glandular cells, 498 ciliated cells, 835 T cells, 2,976 plasma cells, 1,724 fibroblasts, 1,143 endothelial cells, 811 myeloid cells, 273 mast cells.
(b) nUMI and genes identified, and fraction of reads mapping to mitochondrial or ribosomal genes across patient samples; 789 Polyp 1 cells, 1,309 Polyp 2 cells, 1,153 Polyp 3 cells, 913 Polyp 4 cells, 1,219 Polyp 5 cells, 1,141 Polyp 6A cells, 1,334 Polyp 6B cells, 1,314 Polyp 7 cells, 1,286 Polyp 8 cells, 1,481 Polyp 9 cells, 2,988 Polyp 11 cells, 3,109 Polyp 12 cells.
(c) tSNE plot as in Fig. 1b colored by cell types across all patients and then separated by sample; 18,036 single cells (n=12 samples).
(d) The percentage of each cell type recovered within each sample.
(e) Select marker gene overlays displaying binned count-based UMI-collapsed expression level (log(scaled UMI+1)) on a tSNE plot from Fig. 1b for key cell types identified (see Supplementary Table 3 for full gene lists); area under the curve (AUC) 0.998 to 0.7 for all markers displayed.