


Fig. 10.
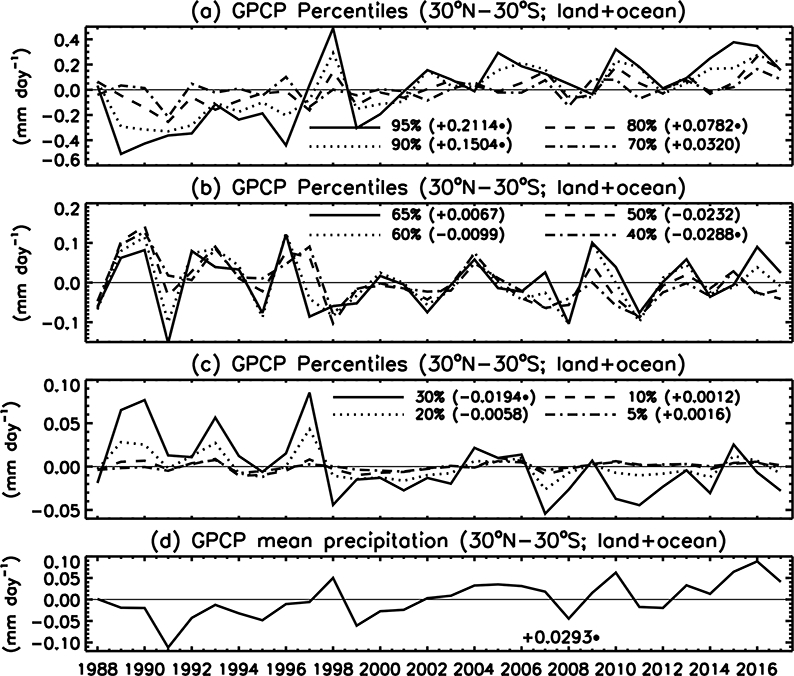
Annual anomalies of (a, b c) precipitation percentiles and (d) mean precipitation determined by GPCP monthly rain-rates for the latitude band 30°N-30°S (land+ocean). Also shown are their corresponding linear trends (mm d−1 decade−1), and those followed by “*” are statistically significant.