


Figure 3. Electome Factor activity correlates with brain-wide cellular firing.
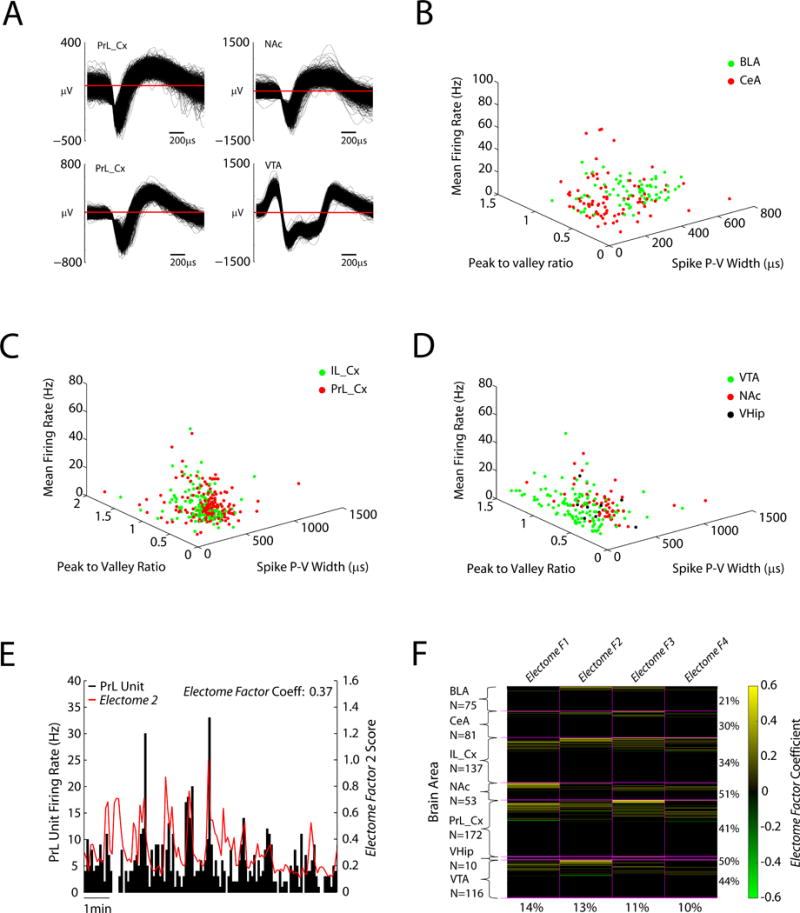
A) Example neuron waveforms. B–D) Mean firing rates are plotted against wave properties (peak to valley ratio and peak to valley width) for amygdala (basolateral and central), prefrontal cortex (prelimbic and infralimbic cortex), VTA, NAc, and ventral hippocampus. E) Example of PFC neuron that showed significant firing relative to Electome Factor 2 activity in the home cage. F) Population firing relative to Electome Factor activity (N = 644 cells). Yellow bars highlight units that showed firing that correlated with Electome Factor activity. Green bars highlight units that showed anti-correlated firing relative to Electome Factor activity. The percentage of units from each area that show firing correlated with one of the four Electome Factors is shown to the right. The percentage of units across the show correlated firing with each Electome Factor (irrespective of recording site) is shown on the bottom.