


Figure 6. znfx-1 mutants exhibit altered patterns of RdRP-dependent small RNAs.
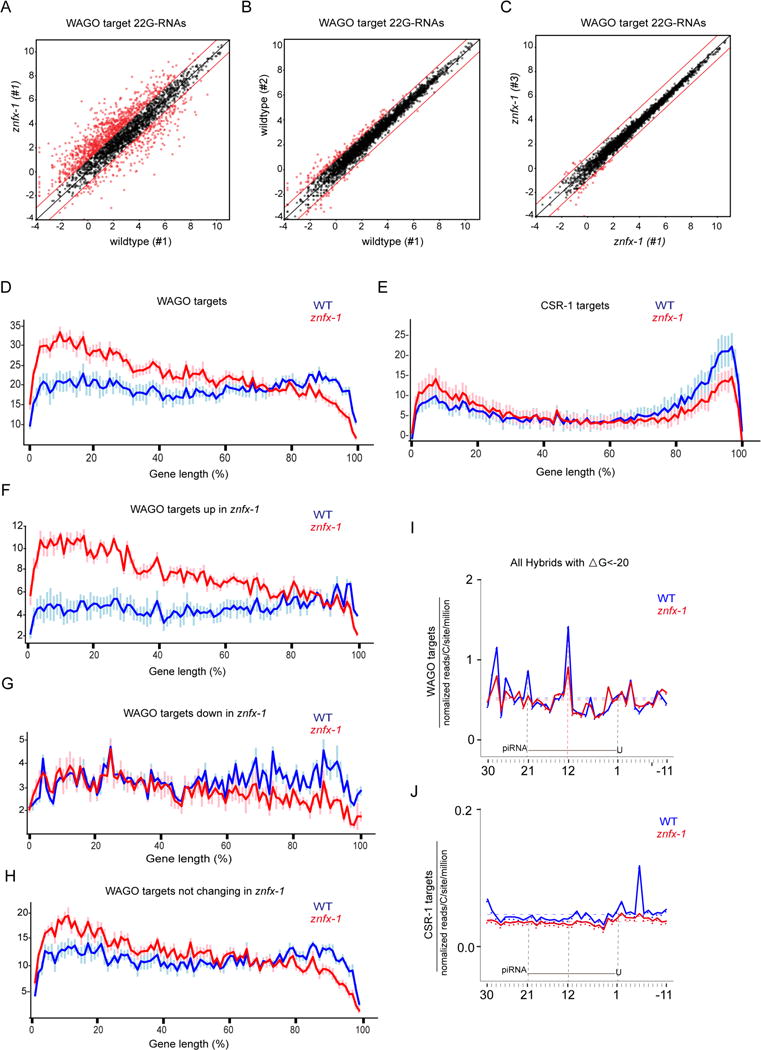
(A) Scatter plot comparing the numbers of small RNA reads (log2) for each WAGO target cloned from wildtype or znfx-1 worms. Each dot represents a WAGO target gene. Red dots represent genes whose 22G-RNAs increase or decrease at least 2-fold (indicated by lines above and below x=y).
(B) Scatter plot as in (A) but comparing two independent wild-type populations.
(C) Scatter plot as in (A) but comparing two independent znfx-1 populations.
(D and E) Distribution of small RNAs along the length of genes in 100 segments (x-axis) on WAGO targets (D) and CSR-1 targets (E). Y-axis represents number of 22Gs in each segment in arbitrary units after normalization to overall 22G levels. Data represented are average values of 6 replicates with standard deviations.
(F-H) Distribution of small RNAs along the length of genes in 100 segments (x-axis) on WAGO targets whose 22Gs goes up (F), goes down (G) or remain unchanged (H). Y-axis represents number of 22Gs in each segment in arbitrary units after normalization to overall 22G levels. Data represented are average values of 6 replicates with standard deviations.
(I and J) 22G-RNA 5′ prime ends mapped at single-nucleotide resolution within a 40-nt window around piRNA target sites determined by prg-1 CLASH in wild-type (blue) or znfx-1 mutant (red) worms, for hybrids with ΔG < -20 kcal/mol. The plots are centered on 21-nt piRNA ± 10 nt shown schematically in each graph. WAGO targets (I) and CSR-1 targets (J) were analyzed separately.
See also Figures S6 and S7.