



Abstract
Adipose tissue maintains a subpopulation of cells, referred to as adipose-derived stromal/stem cells (ASCs), which have been associated with increased breast cancer tumorigenesis and metastasis. For ASCs to affect breast cancer cells, it is necessary to delineate how they mobilize and home to cancer cells, which requires mobilization and invasion through extracellular matrix barriers. In this study, ASCs were separated into four different categories based on the donor’s obesity status and depot site of origin. ASCs isolated from the subcutaneous abdominal adipose tissue of obese patients (Ob+Ab+) demonstrated increased invasion through Matrigel as well as a chick chorioallantoic membrane, a type I collagen-rich extracellular matrix barrier. Detailed mRNA and protein analyses revealed that calpain-4, calpastatin, and MMP-15 were associated with increased invasion, and the silencing of each protease or protease inhibitor confirmed their role in ASC invasion. Thus, the data indicate that both the donor’s obesity status and depot site of origin distinguishes the properties of subcutaneous-derived ASCs with respect to enhanced invasion and this is associated with the dysregulation of calpain-4, calpastatin, and MMP-15.
Keywords: MMP-15, calpastatin, ASC, invasion, obesity, cancer
Introduction
Worldwide, breast cancer mortality rates have increased continuously and substantially and this is correlated with increasing body mass index (BMI) and waist-to-hip ratio (WHR).1-4 Abdominally obese women have a higher risk for developing breast cancer compared to non-obese women or women with normal waist-to-hip ratios. Although both BMI and WHR are predictors of cancer risk, BMI quantifies the volume of adipose tissue, whereas WHR reflects the anatomical distribution of adipose tissue. While studies have shown that increased visceral adipose tissue is associated with increased incidence of cancer, subcutaneous adipose tissue has recently been recognized for its role in angiogenesis and support of tumor growth.5 In addition, both subcutaneous and visceral adipose tissues are composed of a heterogeneous population of cells, which includes adipose-derived stromal stem cells (ASCs). These ASCs have been shown to enhance tumorigenesis and metastasis of both breast cancer cell lines and primary breast cancer samples.6, 7 However, to contribute to breast cancer tumorigenesis and metastasis, it is necessary for endogenous ASCs to egress from adipose tissue and invade through the extracellular matrix (ECM) into the target tissues.8
In order for cells to invade into neighboring tissues, they must express a tissue-invasive phenotype that allows them to traverse the basement membrane and infiltrate the ECM. In humans, four major groups of protease are credited for cellular invasion through the ECM, aspartate protease, serine protease, cysteine protease, and matrix metalloproteinase,9, 10 but the identity of the particular protease that confers tissue-invasive activity to ASCs remains undefined.
Although much remains to be discovered about the molecular machinery that allows both cancer and trafficking cells to disassemble and transmigrate through the ECM, it can be assumed that ASCs utilize similar, if not identical mechanism(s), since they have been demonstrated to traffic to damaged tissues and sites of inflammation.11 The current work hypothesizes that the invasive phenotype of ASCs may be influenced by both obesity status and adipose depot site of origin. Furthermore, ASCs under the influence of obesity-derived factors may possess properties that distinguish them from ASCs isolated from a lean individual., The ASCs may be conditioned by the local microenvironment within their original site and exhibit unique invasive characteristics. Thus, the aim of this study was to determine the invasive potential of ASCs isolated from subjects based on obesity status and depot site and to explore the underlying mechanism for invasion.
Materials and Methods
Materials
Anti-CD45-PeCy7, anti-CD11b-PeCy5, anti-CD166-PE, anti-CD105-PE, anti-CD90-PeCy5, anti-CD34- PE, isotype-control FITC human IgG1 and isotype-control PE human IgG2a were purchased from Beckman Coulter (Indianapolis, IN). Anti-CD44-APC was purchased from BD Biosciences (San Jose, CA). Anti-MMP-12, anti-MMP-15, anti-MMP-21, anti-MMP-23, anti-MMP-28, anti-TIMP-4, anti-calpain-1, anti-calpain-2, anti-calpain-3, anti-calpain-4, anti-calpain-5, anti-calpain-6, anti-calpain-7, and anti-calpain-10 were purchased from Abcam (Cambridge, MA). Anti-calpastatin and anti-actin were purchased from Sigma (St. Louis, MO). Rabbit anti-mouse and goat anti-rabbit HRP-conjugated secondary antibodies were purchased from Abcam. Aspartate proteinase inhibitor, pepstatin A (100 mM), serine proteinase inhibitor, soybean trypsin inhibitor, (SBTI; 100 μg/mL), and cysteine proteinase inhibitor, E64d (1 μM), were purchased from Sigma. Synthetic matrix metalloproteinase (MMP) inhibitor, GM6001 (25 μM), was purchased from Millipore (Bedford, MA), and cathepsin inhibitor, 1,3-Bis(CBZ-Leu-NH)-2-propanone (10 μM), was purchased from EMD Chemicals (Gibbstown, NJ). The calpain inhibitor, acetyl-calpastatin (0.2 μM), was purchased from AnaSpec (Fremont, CA), and the caspase inhibitor, Z-VAD-FMK (20 μM), was purchased from Promega (Madison, WI).
Human Subjects
Primary human adipose stem cells (ASCs) were obtained from 24 Caucasian females undergoing elective liposuction procedures, as previously described.12 ASCs were isolated from processed lipoaspirates from the subcutaneous abdominal adipose tissue of obese (Ob+Ab+) or non-obese (Ob−Ab+) subjects and from non-abdominal subcutaneous adipose depots of obese (Ob+Ab−) and non-obese (Ob−Ab−) subjects. Additional demographic information can be found in Supplemental Material 1. No statistical significance in age was observed between the groups. Six donors per group were individually characterized and expanded. All protocols were reviewed and approved by the Pennington Biomedical Research Center Institutional Review Board and all human participants provided written informed consent.
Cell Culture
ASCs
ASCs were isolated and expanded as previously reported.13 In brief, frozen vials of approximately 106 ASCs were thawed, plated onto 150 cm2 culture dishes (Nunc; Rochester, NY) in 25 ml complete culture media (CCM) that consisted of α-minimal essential medium (GIBCO; Grand Island, NY), 20% fetal bovine serum (Atlanta Biologicals; Lawrenceville, GA), 100 units per ml penicillin (GIBCO), 100 μg/mL streptomycin (GIBCO), and 2 mM L-glutamine (GIBCO) and incubated at 37.5°C with 5% humidified CO2. After 24 hours, the media was removed and adherent, viable cells were washed twice with phosphate buffered saline (PBS), harvested with 0.25% trypsin/1mM EDTA (Gibco), and replated at 100 cells/cm2 in CCM. Media was changed every 3-4 day. For all experiments, sub-confluent cells (≤70% confluent) between passages 2-6 were used.
MDA-MB-231 cells
MDA-MB-231 cells were obtained from American Type Culture Collection and were cultured in Dulbecco’s Modified Eagle’s Medium (DMEM; GIBCO), supplemented with 10% FBS, 100 units per mL penicillin, and 100 μg/mL streptomycin. Cells were grown at 37°C with 5% humidified CO2, fed every 2-3 days, and split 1:4 to 1:6 when they reached 90% confluent.
Conditioned Media
MDA-MB-231 cells were cultured in DMEM, supplemented with 10% FBS, 100 units per mL penicillin, and 100 μg/mL streptomycin for 24 hours. After 24 hours, the cells were washed twice with serum free DMEM and further cultured for 48 hours in serum free DMEM. The conditioned media was filtered (0.22 μM) to remove any cellular debris.
Differentiation Protocols
Adipogenic Differentiation
ASCs were cultured in 6-well plates in CCM until 70% confluent. Media was replaced with fresh media containing adipogenic supplements, consisting of 0.5 μM dexamethasone (Sigma), 0.5 mM isobuytlmethylxanthine (Sigma), and 50 μM indomethacin (Sigma). After three weeks, cells were fixed in 10% formalin for 1 hour at 4°C, stained for 10–15 minutes at room temperature with Oil Red O (Sigma) to detect neutral lipid vacuoles, and images were acquired at 10× magnification on Nikon Eclipse TE200 (Melville, NY) with Nikon Digital Camera DXM1200F using the Nikon ACT-1 software version 2.7.
Osteogenic Differentiation
ASCs were cultured in 6-well plates in CCM until 70% confluent. Media was replaced with fresh media containing osteogenic supplements, consisting of 50 μM ascorbate 2-phosphate (Sigma), 10 mM β-glycerol phosphate (Sigma), and 10 nM dexamethasone. After three weeks cells were fixed in 10% formalin for 1 hour at 4°C and stained for 10 minutes with 40 mM Alizarin Red (pH 4.1) to visualize calcium deposition in the extracellular matrix. Images were acquired at 4× magnification on Nikon Eclipse TE200 with Nikon Digital Camera DXM1200F using Nikon ACT-1 software version 2.7.
Colony Forming Unit Assay
ASCs were plated at a density of 100 cells on a 10 cm2 plate in CCM and incubated for 14 days. Plates were rinsed three times with PBS, and 10 mL of 3% crystal violet (Sigma) was added for 30 minutes at room temperature. Plates were washed three times with PBS and once with tap water. Colonies that were larger than 2 mm in diameter were counted. Each experiment was performed in triplicate.
Flow Cytometry
ASCs were harvested with 0.25% trypsin/1mM EDTA for 3-4 minutes at 37°C. A total of 3 × 10⁵ cells were concentrated by centrifugation at 500 × g for 5 min, suspended in 50 μl PBS and labeled with the primary antibodies. The samples were incubated for 30 minutes at room temperature and washed three times with PBS. The samples were then analyzed by FACScan (FACScalibur; BD Biosciences) with CellQuest software (BD Biosciences). To assay cells by forward and side scatter of light, FACScan was standardized with microbeads (Dynosphere uniform microspheres; Bangs Laboratories Inc.; Thermo Scientific; Waltham, MA). At least 10,000 events were analyzed and compared with isotype controls.
Transwell Invasion Assay
Invasion assays were performed in transwell inserts with 8-μm pore membrane filters pre-coated with a growth factor-reduced Matrigel layer to mimic basement membranes (BD Biosciences). ASCs were grown to 70% confluent prior to harvesting by trypsinization and pooled based on obesity status and depot site. ASCs were loaded (5 × 10⁴ cells/well in 500 μL) onto the upper chamber, while 750 μL MDA-MB-231 conditioned media was loaded onto the bottom chamber. Where indicated, ASCs were pretreated with protease inhibitors for 4 hours prior to loading onto the upper chamber, and fresh protease inhibitors were added to the upper chamber for the duration of the invasion assay. After overnight incubation, the lower side of the transwell insert was carefully washed with cold PBS and non-invading cells remaining on the top chamber were removed with a cotton tip applicator. Invading cells were stained with Calcein-AM (2 μg/ml; Invitrogen; Grand Island, NY) and measured on a fluorescent plate reader (FLUOstar optima; BMG Labtech Inc.; Durham, NC). Data was normalized by dividing the values obtained with or without MDA-MB-231 conditioned media as a chemoattractant by the values obtained without conditioned media. Where ASCs were treated with protease inhibitors, the data was normalized by dividing the values obtained with each treatment group by the values obtained without protease inhibitor treatment to determine the percentage of inhibition.
RNA Isolation and Reverse Transcriptase Polymerase Chain Reaction (RT-PCR)
Subconfluent cultures of ASCs were grown in conditioned media for 24 hours. The three donors in each category were pooled based on obesity status and depot site prior to total RNA extraction from ASCs using TRIzol reagent (Invitrogen) and purification with DNase I digestion (Invitrogen). A total of 200 ng of cellular RNA was used for cDNA synthesis and PCR with the SuperScript III One-Step RT-PCR System with Platinum Taq (Invitrogen). No-template controls (negative control, neg ctrl) were run to rule out cross contamination of reagents and surfaces. All PCR products were analyzed by gel electrophoresis on 2.0% agarose gels with ethidium bromide stain. Gels were imaged with ImageQuant LAS 4000 (GE Healthcare Life Science; Piscataway, NJ) and representative image of one of three independent experiments are shown. Quantitative analysis of RT-PCR was performed by densitometry. MMP primer sets were designed by Kohrmann et al.14 The primer sets used in the RT-PCR are listed in Supplemental Material 2.
Protein Isolation and Western Blot
Subconfluent cultures of ASCs were grown in conditioned media for 24 hours. The three donors in each category were pooled based on obesity status and depot site prior to cell lysis with RIPA buffer (Pierce; Thermo Scientific). The cell lysate was clarified by centrifugation at 15,000 × g for 15 min. Protein concentration was determined by the BCA Protein Assay (Pierce). Lysate (20 μg) was resolved on 4-12% SDS-polyacrylamide gels and transferred to nitrocellulose membranes (Invitrogen). Blots were blocked with blØk Noise Canceling Reagents (Millipore). Blots were then incubated with the primary antibodies overnight at 4°C and washed with PBS with Tween 20 three times before incubated with species-specific IgG conjugated to horseradish peroxidase for 1 hour at room temperature. Antigen-antibody complexes were visualized after incubation in chemiluminescence reagent (Invitrogen). Blots were imaged on an ImageQuant LAS 4000 and representative blots of one of three independent experiments are shown. Quantitative analysis of Western blots was performed by densitometry.
Zymography
Subconfluent cultures of ASCs were grown in conditioned media for 24 hours. The three donors in each category were pooled based on obesity status and depot site prior to suspension media collection and concentrated with protein concentrators (Pierce). A total of 20 μg of protein was loaded under non-denaturing conditions into Novex Precast Polyacrylamide Zymography Gels supplemented with 0.1% gelatin (Invitrogen). Electrophoresis was performed at a constant voltage of 120 V for 90 min. Gels were washed with Novex Zymogram Renaturing Buffer (Invitrogen) and incubated overnight in Novex Zymogram Developing Buffer (Invitrogen) according to Manufacturer’s instructions. Gels were stained with Simply Blue SafeStain (Invitrogen) for 1 hour and then washed with water for 1 hour. Gels were incubated with Gel-Dry Drying Solution (Invitrogen) for 5 minutes before being placed between cellophane for drying overnight. After gels dried overnight, zymograms were recorded with ImageQuant LAS 4000 and representative zymographs of one of three independent experiments are shown. Quantitative analyses of zymographs were analyzed by densitometry.
Stable Transfection of shRNA
Short hairpin RNA constructs targeting MMP-14, MMP-15, calpain-4, and calpastatin and an shRNA construct targeting a non-human gene serving as a control were purchased from SABiosciences (Frederick, MD). The following shRNA constructs were used: MMP-14 (5′-gcccaatggaaagacctactt-3′), MMP-15 (5′-aaccgcgtcctggacaactat-3′), calpain-4 (5′-cgacgctactcagatgaaagt-3′), calpastatin (5′-aaaccacaagacatgatttct-3′), and non-coding gene (5′-ggaatctcattcgatgcatac-3′). ASCs were transfected with shRNA using the Neon Transfection System (Invitrogen), using 1400 V for the pulse voltage, 10 ms for the pulse width, and 3 pulses. Cells were allowed to recover for 48 hours before selection with Geneticin (Invitrogen). For selection, 600 μg/mL of Geneticin diluted in fresh CCM was replaced every 2 days, and the selection was performed for 14 days.
Chick Chorioallantoic Membrane (CAM) Assays
Fertilized white leghorn chick embryos were obtained from Charles River Laboratories (Wilmington, MA). Following 2 days of incubation in a 37°C humidified incubator, eggs were swabbed with 70% ethanol, and embryos were carefully removed from the shell using a Dremel tool and placed in a sterile, covered weigh boat and returned to the incubator. On day 10 of incubation, 106 ASCs were labeled with 10 μM CellTracker Green CMFDA (Invitrogen), resuspended in 100 μl PBS, and added onto the CAM on a nylon mesh for localization of the cells as previously described.15-18 After 3 days of incubation, the areas of interest were dissected out, fixed in 4% paraformaldehyde, frozen in OCT, and cut into 8 μm sections. The percentage of invading cells was quantified in three or more randomly selected fields. Depth of invasion from the CAM surface was defined as the leading front of three or more invading cells in randomly selected fields. Images were acquired on Olympus BXS1W1 spinning disk confocal microscope (Center Valley, PA) with Hamamatsu EM-CCD C9100 camera (Hamamatsu City, Japan) using Slidebook version 5.0 software (Olympus).
Statistical Analysis
All values are presented as means ± SD. The statistical differences among two or more groups were determined by ANOVA, followed by post-hoc Dunnet multiple comparison tests versus the respective control group. The statistical differences between two groups were performed by Student’s t-test. Statistical significant was set at P < .05. Analysis was performed using Prism (Graphpad Software, San Diego, CA).
Results
Characterization of ASCs isolated from donors based on obesity status and depot site of origin
ASCs were isolated from processed lipoaspirates of obese (Ob+) and non-obese (Ob−) subjects undergoing elective plastic surgery and obtained from the subcutaneous abdominal adipose tissue (Ab+) or non-abdominal subcutaneous depots (Ab−). The ASC from all groups (Ob+Ab+, Ob+Ab−, Ob−Ab+, Ob−Ab−) were found to be positive for CD44, CD90, CD105, and CD166 and negative for CD34, CD45, and CD11b via flow cytometry (Figure 1A). Each group of ASCs was able to differentiate into adipocytes and osteoblasts (Figure 1B) as well as generate colony-forming units (Figure 1C). No differences were observed among the four groups for ASC differentiation or self-renewal capacity as defined by colony forming units (Figure 1C).
Figure 1. Characterization of ASCs isolated from donors based on obesity status and deposit site.
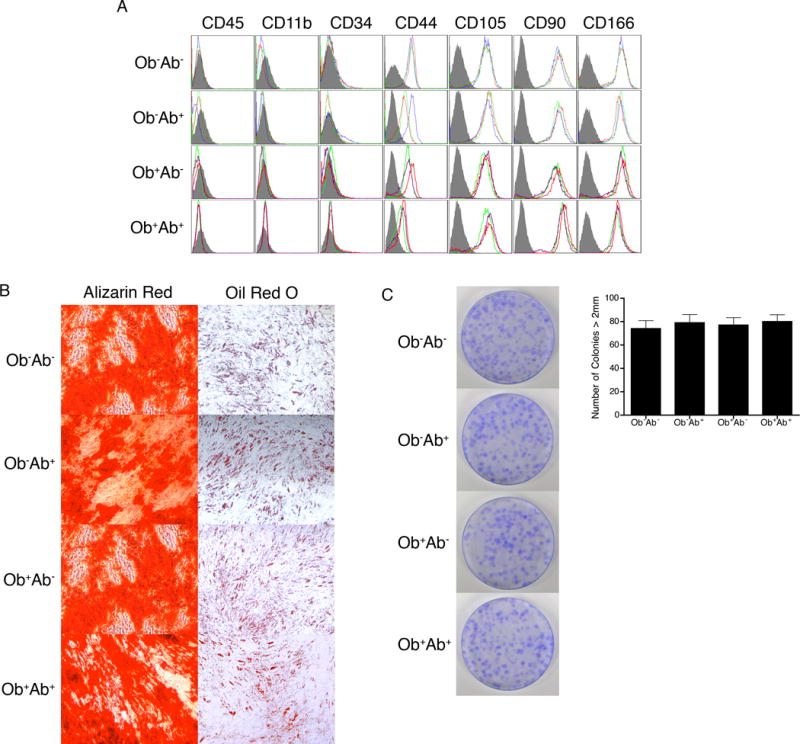
(A) ASCs in each of the four groups were stained with antibodies against the indicated antigens and analyzed by flow cytometry. Histograms are shown as colored lines and the respective isotype controls are shaded in gray. (B) ASCs were grown until 70% confluent in CCM and then switched to differentiation media. After 21 days, cells were fixed and stained with Alizarin Red for osteogenesis and Oil Red O for adipogenesis. Representative images for each group are shown. Original magnification for osteogenesis is 4x and for adipogenesis is 10x for all panels. (C) CFUs were seeded at low density and incubated in CCM for 14 days. Cells were fixed and stained with crystal violet. Representative image for each group are shown. Bars, ± SD.
Ob+Ab+ ASCs demonstrate increased invasion towards breast cancer cell conditioned media
To investigate the invasive potential of ASCs in response to breast cancer cells, conditioned media from MDA-MB-231 cells was placed in the lower chamber of a growth factor reduced Matrigel coated transwell insert, while ASCs were plated onto the top chamber. All four ASC groups invaded towards conditioned media with statistically significance increases compared to control after 24 hour (P<0.05). Invasion of Ob+Ab+ ASCs was increased by 7.5 fold relative to control (unconditioned media), whereas the invasion of Ob+Ab−, Ob−Ab+, and Ob−Ab− ASCs was increased by 2.8-, 3.6-, and 3.8-fold, respectively. Invasion of Ob+Ab+ ASCs invaded was significantly more compared to Ob+Ab−, Ob−Ab+, and Ob−Ab− ASCs (P<.001)
GM6001 and acetyl-calpastatin inhibit Ob+Ab+ ASC invasion
To determine the protease responsible for the robust invasion of Ob+Ab+ ASCs towards breast cancer conditioned media, all four groups of ASCs were pretreated with blanket inhibitors for 4 hours to the four protease classes found in humans: cysteine, serine, aspartate, and matrix metalloproteinases (MMP). Inhibition of Ob+Ab+ ASCs with E64d and GM6001 significantly impaired the invasion of these ASCs by 34% and 62%, respectively, when compared with untreated control cells (Figure 3A). To further reveal the protease(s) involved, Ob+Ab+ ASCs were pretreated with blanket inhibitors to the three classes of cysteine proteases: cathespins, calpain, and caspases. Pretreatment of the ASCs with calpain inhibitor acetyl-calpastatin reduced the invasion of Ob+Ab+ ASC by 40% relative to cells that were not treated (Figure 3B). ASCs pretreated with cathespin and caspase inhibitors had no effect on invasion. No changes in cell viability or proliferation were observed after treatment with protease inhibitors (data not shown). These experiments indicate that both MMPs and calpains are involved in the invasion of Ob+Ab+ ASCs.
Figure 3. Protease inhibitors limit ASC invasion.
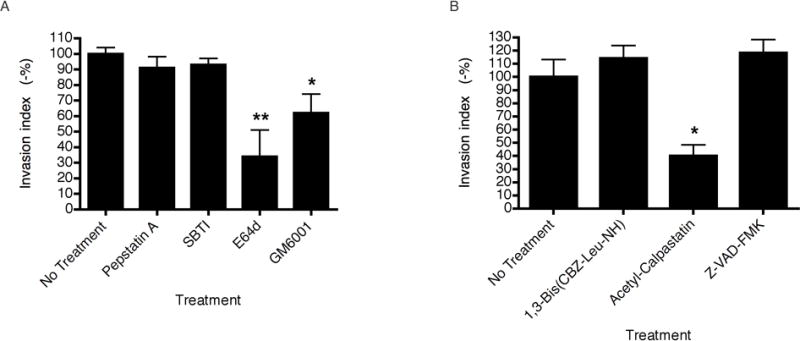
Ob+Ab+ ASCs were pretreated with protease inhibitors for 4 hours and placed onto transwell inserts with 8 μm pore membrane filters pre-coated with growth factor-reduced Matrigel in the presence of protease inhibitors. The bottom chamber was loaded with MDA-MB-231 conditioned media and incubated for 24 hours. (A) ASCs were pretreated with broad-spectrum protease inhibitor Pepstatin A (100 mM), SBTI (100 μg/mL), E64d (1 μM), or GM6001 (25 μM) for 4 hours prior to being placed onto transwell inserts. (B) ASCs were pretreated with cysteine protease inhibitor 1,3-Bis(CBZ-Leu-NH)-2-propanone (10 μM), acetyl-calpastatin (0.2 μM), or Z-VAD-FMK (20 μM) for 4 hours prior to being placed onto transwell inserts. Data was normalized by dividing the values obtained with each treatment group by the values obtained without protease inhibitor treatment and represented as a percentage. Values are means of three independent experiments, each performed in triplicates. Bars, ± SD. *P < .05, **P < .005.
mRNA expression of MMPs and calpains vary among the four groups
To further identify the protease(s) involved in the invasion, ASCs were grown in the absence and presence of MDA-MB-231 conditioned media prior to the isolation of RNA and detection of mRNA expression by RT-PCR. Primer sets were constructed for the detection of specific MMPs and calpains along with the endogenous inhibitors of these proteases, which included the TIMPs and calpastatin, respectively (Supplemental Material 2).
Of the MMPs and TIMPs, the mRNAs for 18 MMPs and 4 TIMPs were detected in all groups of ASCs (Supplemental Material 3). However, the levels of mRNA expression of MMP-2, -9, -12, -15, -21, -23, and -28 as well as TIMP-4 varied among the four groups (Figure 4). More specifically, levels of MMP-2, MMP-9, and MMP-28 were increased by 1.3-fold, 1.8-fold, and 1.8-fold, respectively, in Ob+ ASCs. In contrast, the mRNA level of MMP-12, MMP-21, MMP-23 and TIMP-4 were increased by 1.3-fold, 2.2-fold, 2.4-fold, and 1.4-fold, respectively, in Ob− ASCs. Of particular interest was the increase in MMP-15 expression in the Ob+Ab+ ASCs compared to the other 3 groups of ASCs, indicating the potential involvement of MMP-15 in the enhanced invasion of Ob+Ab+ ASC.
Figure 4. RT-PCR analyses of MMP, TIMP, calpain, and calpastatin from different ASC populations.
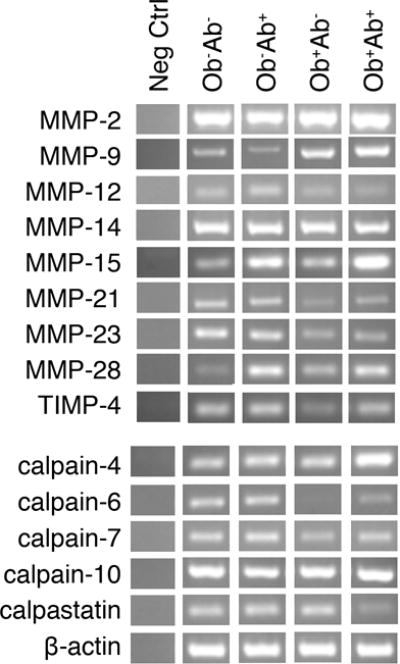
ASCs were cultured in CCM until 70% confluent and grown in breast cancer conditioned media for 24 hours. Cells were harvested and RNA extraction was conducted with TRIzol and purified with DNase digestion. A total of 200 ng of total RNA was used for cDNA synthesis and PCR analysis. No-template controls (neg ctrl) were run to rule out cross contamination of reagents and surfaces. PCR products were analyzed by gel electrophoresis on 2.0% agarose gels with ethidium bromide stain. β-actin is shown as a standard reference. Primer sets are listed in Supplemental Material 2. Bars, ± SD. *P < .05
Of the 15 calpains and calpastatin, the mRNAs for 9 calpains and calpastatin were present at detectable levels in all groups of ASCs (Supplemental Material 3; Supplemental Material 4); however, levels of calpain-4, -6, -7, and -10 varied among the four groups (Figure 4; Supplemental Material 4). mRNA expression of calpain-4 was increased 2.5-fold in the Ob+Ab+ ASCs compared to the other three groups. RNA expression of calpain-6 and calpain-7 was decreased in the Ob+ groups by 2.3-fold and 2.5-fold, respectively. In addition, Ob+Ab+ ASCs showed significant reduction by 3.5-fold in calpastatin mRNA expression (Figure 4; Supplemental Material 4).
Expression and activity of MMPs and calpains vary among the four groups
Western blots or zymograms were performed on the protease or protease inhibitors that displayed varying RNA expression among the four groups. To confirm the protein expression of MMP-2 and MMP-9, zymography was performed with conditioned media serving as a baseline control. MMP-2 and MMP-9 activity levels were increased in Ob+ groups as compared to Ob− groups (Figure 5A).
Figure 5. Zymographic and Western blot analyses of MMP, TIMP, calpain, and calpastatin in different ASC population.
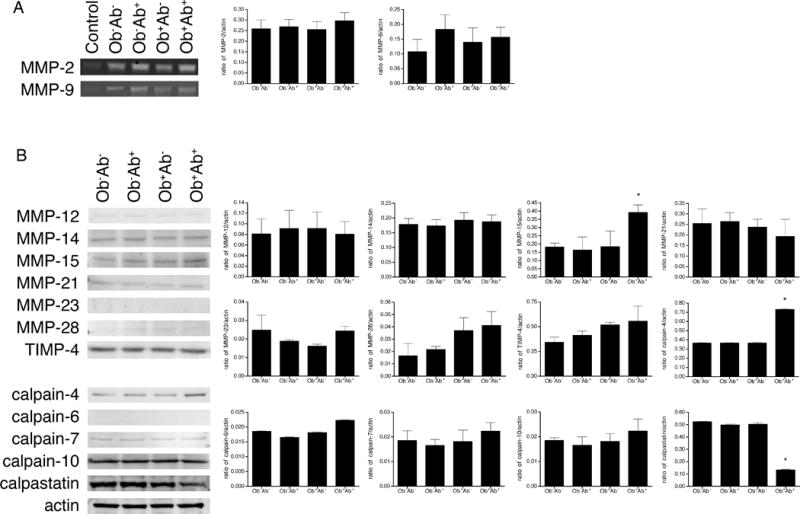
ASCs were cultured in CCM until 70% confluent and grown in breast cancer conditioned media for 24 hours. (A) Zymographic analysis of gelatinase secretion from ASCs. A total of 20 μg of culture supernatants were analyzed. Breast cancer conditioned media was used as a control to demonstrate basal levels of protein content prior to ASC exposure. (B) Western blot detection of ASC cell lysate. Again, 20 μg of protein was separated by SDS-PAGE under reducing conditions, blotted, and probed with indicated antibodies. Bars, ± SD. *P < .05
Western Blotting was performed for MMP-12, MMP-15, MMP-21, MMP-23, MMP-28, TIMP-4, calpain-4, calpain-6, calpain-7, calpain-10, calpastatin, with beta-actin serving as a control. The expression of MMP-14 was assessed as well because previous studies have suggested MMP-14 as the sole molecule responsible for the invasion of bone marrow derived MSC (BMSCs).17, 19 Western blot analysis showed no differences in protein expression of MMP-12, MMP-14, MMP-21, MMP-23, MMP-28, TIMP-4, calpain-6, calpain-7, or calpain-10. Western Blot confirmed the decrease in calpastatin expression by 4.0-fold in Ob+Ab+ ASCs relative to other ASCs (Figure 5B). Increased expression in MMP-15 and calpain-4 by 2.2- and 2.0-fold, respectively, was observed in Ob+Ab+ ASCs when compared with the other ASC groups (Figure 5B).
Reduced calpastatin and enhanced calpain-4 expression increase invasion
To confirm the functional role of calpastatin and calpain-4 in invasion, ASCs were transfected with calpastatin or calpain-4 shRNA (Figure 6A). Knockdown efficiency was assessed with Western blot analysis after antibiotic selection was complete. Calpastatin knockdowns in Ob−Ab−, Ob−Ab+, and Ob+Ab− ASCs showed a reduction in protein expression of calpastatin by 78%, 82%, and 80%, respectively. Calpastatin knockdown in Ob+Ab+ ASCs was comparable to nontransfected ASCs, suggesting knockdown efficiency of calpastatin in Ob+Ab+ was low, possibly due to low levels of endogenous calpastatin in these cells. Protein expression of calpain-4 was decreased in all four groups after shRNA transfection and antibiotic selection, with the greatest decrease of 87% observed in Ob+Ab+ ASCs.
Figure 6. ASC invasion influenced by shRNA knockdown.
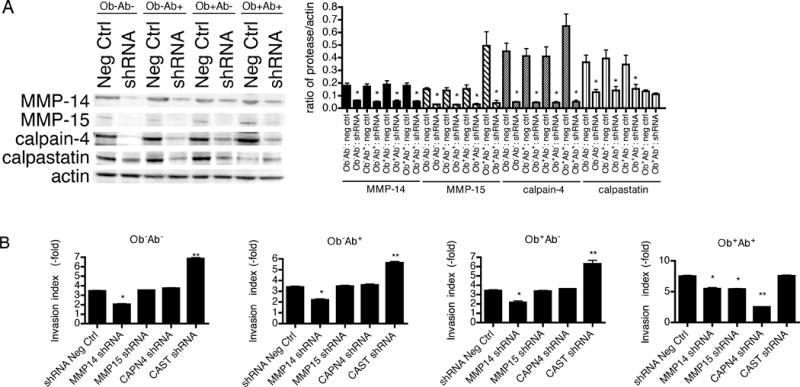
ASCs were transfected with an shRNA construct targeting a non-human gene (shRNA Neg Ctrl) or an shRNA construct targeting the gene of interest (shRNA) followed by antibiotic selection. (A) ASCs expressing the shRNA vectors were assessed for their efficiency of gene inhibition by Western blot analysis. About 20 μg of cell lysate isolated from transfected ASCs grown in conditioned media for 24 hours were separated by SDS-PAGE under reducing conditions, blotted, and probed with the indicated antibodies. (B) The shRNA transfected ASCs were seeded in the upper compartment of the transwell inserts with 8-μm pore membrane filters pre-coated with growth factor-reduced Matrigel and incubated for 24 hours. Data was normalized by dividing the values obtained with serum-free media or MDA-MB-231 conditioned media as a chemoattractant by the values obtained for the serum-free media (set as 1). Values are means of three independent experiments, each performed in triplicates. Bars, ± SD. *P < .05, **P < .01.
Functionally, Ob−Ab−, Ob−Ab+, and Ob+Ab− ASCs transfected with calpastatin shRNA demonstrated increased invasion towards conditioned media compared to shRNA negative control cells or naïve untransfected cells (Figure 6B). Invasion of Ob+Ab+ ASCs transfected with calpastatin shRNA showed a similar invasive phenotype as the naïve untransfected cells or shRNA negative control Ob+Ab+ ASCs (Figure 6B). No significant difference in invasion was observed between the four groups of ASCs after calpastatin shRNA transfection. These experiments confirm that low calpastatin expression correlates with enhanced invasion. Calpain-4 knockdowns in Ob+Ab+ ASCs diminished the invasion by 5-fold and negated the enhanced invasion observed in Ob+Ab+ ASCs exposed to breast cancer cell conditioned media. These observations indicate that the simultaneous reduction in calpastatin and increase in calpain-4 in Ob+Ab+ ASCs contribute to the cellular invasion.
Assessing variability of MMP-15, calpain-4, and calpastatin expression
In order to assess the variability between donor samples within groups and between groups, an additional 3 donors were obtained for each ASC group, resulting in a total of 24 donor samples. ASCs were primed in MDA-MB-231 conditioned media prior to the isolation of protein and, where indicated, were pooled according to donor’s obesity status and depot site, prior to blotting with MMP-15, calpain-4, or calpastatin antibody. Quantification of Western blots with densitometry demonstrated no statistically significant variability within the groups, while statistically significant differences were observed between the groups as demonstrated with the analysis of the pooled samples (Supplemental Material 5).
Inhibition of MMP-15 shRNA reduced invasion of ASCs
To determine the role of MMP-15 on ASC invasion, ASCs were transfected with MMP-15 shRNA followed by antibiotic selection. MMP-14 shRNA was also assessed because previous studies have suggested that MMP-14 may be responsible for BMSC invasion.10,11 Knockdown efficiency was assessed through Western blot analysis. Protein expression of MMP-14 and MMP-15 was decreased in all four groups after shRNA transfection and antibiotic selection (Figure 6A). Since high levels of endogenous MMP-15 were found in Ob+Ab+ ASCs, the greatest decrease in expression after shRNA knockdown was observed in Ob+Ab+ ASCs.
Functionally, inhibition of MMP-14 resulted in a 2-fold decrease in all four groups, indicating that all ASCs can utilize, but do not require MMP-14 to invade (Figure 6B). After MMP-14 shRNA knockdown, Ob+Ab+ ASCs retained their enhanced invasion, suggesting that MMP-14 is not responsible for the enhanced invasion of Ob+Ab+. In contrast, inhibition of MMP-15 demonstrated reduced invasion in Ob+Ab+ ASCs by 2-fold, although no significant changes were observed in the invasion of Ob+Ab−, Ob−Ab+, or Ob−Ab− ASCs. ShRNA knockdown of MMP-15 abolished the enhanced invasion of Ob+Ab+ ASCs in response to breast cancer cell conditioned media, suggesting that these cells utilize an alternative pathway with MMP-15 as their central player.
Invasion of hASCs in vivo
To evaluate ASC invasion in a complex ECM model system that inherently contains various chemokines and chemoattractants, an in vivo chick CAM model was used. The CAM contains a type I collagen-rich ECM barrier commonly used to study invasive processes.15,18 The shRNA negative control of Ob+Ab+ ASCs demonstrated enhanced invasion compared to control Ob+Ab−, Ob−Ab+, or Ob−Ab− ASCs. While MMP-14 knockdown in ASCs significantly reduced the invasion of Ob+Ab−, Ob−Ab+, and Ob−Ab− ASCs, Ob+Ab+ ASCs maintained their more invasive phenotype compared to the other groups. In contrast, knockdowns of MMP-15 and calpain-4 in Ob+Ab+ ASCs reduced the invasive phenotype of these cells to the same invasiveness as other ASCs, while knockdowns of MMP-15 and calpain-4 in Ob+Ab−, Ob−Ab+, and Ob−Ab− ASCs had no effect on the invasion of these cells, suggesting the use of MMP-15 and calpain-4 by Ob+Ab+ ASCs but not by Ob+Ab−, Ob−Ab+, or Ob−Ab− ASCs. In comparison, knockdowns of calpastatin in Ob+Ab+ ASCs demonstrated no effect on the invasion of these cells, while knockdowns of calpastatin in Ob+Ab−, Ob−Ab+, and Ob−Ab− ASCs demonstrated enhanced invasion. Interestingly, although levels of invasion in Ob+Ab−, Ob−Ab+, and Ob−Ab− ASCs were increased with calpastatin shRNA, naïve Ob+Ab+ ASCs remained more invasive, indicating that an additional molecule may be required for invasion.
Discussion
ASCs have been shown to be recruited to damaged tissue and inflammation, which are hallmarks of cancer.11, 20 However, the invasive potential of ASCs based on obesity status and depot site of origin have not been previously investigated. The combined use of Matrigel™ and the chick CAM models interrogate ASC invasion through the perforation of basement membrane barriers as well as intravasate vascular networks in vivo. This study is among the first to show that ASCs isolated from the subcutaneous abdominal adipose tissue of obese patients, Ob+Ab+ ASCs, have enhanced invasion due to increased expression of MMP-15 and calpain-4 and decreased expression of calpastatin. These findings are consistent with recent reports documenting increased levels of colony forming unit mesenchymal progenitor cells recovered from the circulation of obese relative to lean subjects and further increases in this cell population in patients with colorectal cancer.21, 22
MMP-15 knockdown in Ob+Ab+ ASCs demonstrated decreased invasion. Other studies have shown that cancer cells expressing MMP-15 play a role in degrading the venular basement membranes during angiogenesis, and invasive cells express higher levels of MMP-15 compared to non-invasive cells.23, 24 Additional studies have demonstrated that hypoxic conditions can lead to the dysregulation of MMP-15, resulting in an invasive phenotype.25 In obesity, the rapid proliferation and hypertrophy of cells results in excessive accumulation of adipose tissue and hypoxia due to inadequate blood supply to maintain the tissue.26 Therefore, it is possible that Ob+Ab+ ASCs, due to their local hypoxic conditions, acquire an invasive phenotype through the dysregulation of MMP-15.
It should be noted that previous work conducted with MMP-14 and MMP-15 has been conducted with BMSCs rather than with ASCs. The discrepancy seen between previously published data and our data may be explained by the inherent differences between BMSCs and ASCs. Previous studies investigating the protease(s) involved in BMSC invasion identified MMP-14 as a major molecule contributing to ECM degradation and BMSC invasion.17, 19 The current study has shown that ASCs also use MMP-14 for invasion, but MMP-14 knockdown did not diminish the enhanced invasion observed in Ob+Ab+ ASCs, suggesting MMP-14 alone is not responsible for the enhanced invasion observed in these ASCs. Quantitative comparisons between these two different cell types have revealed differences at the transcriptional and proteomic levels as well as functional differences in their differentiation processes.27, 28
The current study demonstrates that the calpain-calpastatin system is involved in the invasion of ASCs. In resting cells, calpastatin inhibits calpains, which are calcium dependent cysteine proteases.29 However, upon the activation of calpains in vivo, calpains mediate the degradation of calpastatin, resulting in increased protein synthesis of calpain.30, 31 The aggregation of calpastatin and its sub-cellular redistribution also serve as mechanisms that facilitate calpain activation by compartmentalizing the calpastatin.32 The interplay between calpain and calpastatin provide an interesting area of investigation because of their involvement in cellular invasion.33 In breast cancer, decreased calpastatin expression has been shown to be involved in lymphovascular invasion.34 Calpain-4 over-expression has been linked with enhanced invasiveness of hepatocellular carcinoma cells and siRNA-mediated knockdown expression of calpain-4 significantly inhibited the motility and invasive phenotype of these cells.35 Additional studies using calpain-4 knockout fibroblast revealed decreased cell migration rates, altered actin cytoskeleton organization, and proteolytic cleavage of focal adhesion kinase (FAK), paxillin, spectrin, cortactin, and talin 1.36 These studies support the involvement of the calpain-calpastatin system in cellular invasion mechanisms, and our present study confirmed the role of calpastatin and calpain-4 specifically on ASC invasion.
While the studies described here utilized ASCs isolated from subcutaneous adipose tissue expanded in vitro, another interesting avenue for further investigation will be to focus on the biologic properties and invasive potential of non-cultured ASCs isolated directly from the stromal vascular fraction. Previous studies have utilized FACS sorted or magnetic bead purified ASCs to isolate progenitor cells from adipose tissue,37, 38 but further investigation is necessary to determine potential differences in the invasive potential of non-cultured ASCs with respect to depot site of origin and BMI status of the subjects. Furthermore, while our study focused on the biology of ASCs isolated from subcutaneous adipose tissue, the study of ASCs from visceral adipose tissue may provide further insight into the influence of obesity on the ASC biology. Studies comparing ASCs isolated from visceral and subcutaneous adipose tissue indicated differences in proliferation capacity and adipogeneic potential, while no significant differences were observed in differentiation capacity, morphological properties, and immunophenotypic properties.39-41 Further comparison studies will be necessary to determine molecular differences in these ASCs as they relate to obesity.
Taken together, the results from our analysis combined with data from other investigators clearly describe the key proteases involved in ASC invasion through ECM barriers. Collectively, data from these studies suggest that the invasive capacity of ASCs is based on inherent variation between depots of subcutaneous adipose tissue.42, 43 Additional studies will be needed to understand the causes of and mechanism(s) driving obesity-induced changes between subcutaneous adipose tissue depots.
Supplementary Material
Supplemental Material 1. Donor demographics.
Supplemental Material 2. Primer sets used in amplification of ASC mRNA regions.
RNA was extracted from ASCs primed with breast cancer conditioned media. Analysis of RNA expression of ASCs was analyzed by gel electrophoresis. β-actin is shown as a standard reference. Primer sets are listed in Supplemental Material 2.
Densitometry was performed on RT-PCR gel electrophoresis and represented as a ratio relative to β-actin. Bars, ± SD. *P < .05.
Protein lysate was isolated from ASCs isolated from 24 donors and primed with breast cancer conditioned media. Where indicated, samples isolated from donors with the same obesity status or depot site were pooled together for analysis. A total of 20 μg of protein was separated by SDS-PAGE under reducing conditions, blotted, and probed for MMP-15, calpain-4, and calpastatin. Bars, ± SD. *P < .05.
Figure 2. Invasion of ASCs towards conditioned media.
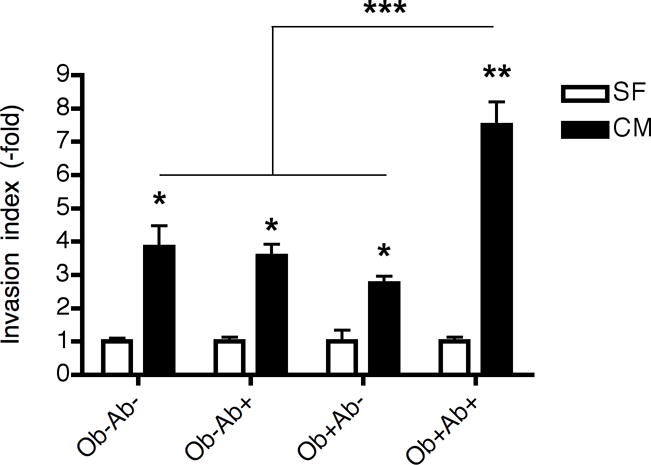
ASCs were placed onto transwell filters coated with growth factor reduced Matrigel and incubated for 24 hours in serum free or MDA-MB-231 conditioned media (CM) or serum free media (SF). Data was normalized by dividing the values obtained with or without MDA-MB-231 conditioned media as a chemoattractant by the values obtained without conditioned media (set as 1). Values are means of three independent experiments, each performed in triplicate. Bars, ± SD. *P < .05, **P < .01, ***P < .001.
Figure 7. The role of MMP-15, calpain-4, and calpastatin in ASC invasion in the CAM model.
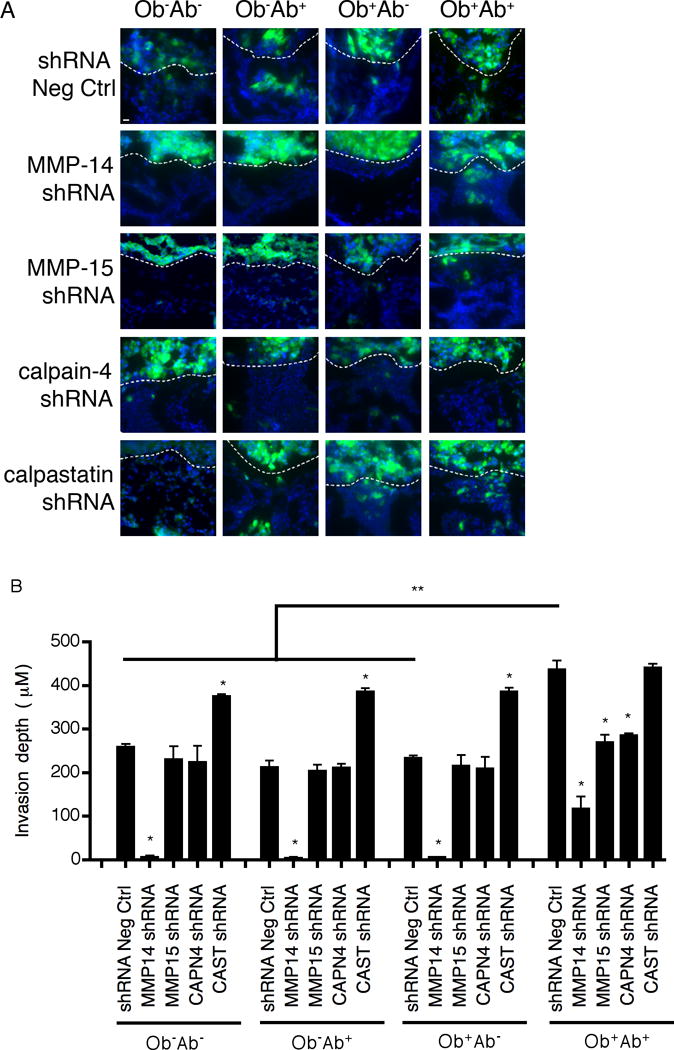
ASCs transfected with an shRNA construct targeting a non-human gene (shRNA Neg Ctrl) or an shRNA construct targeting the gene of interest (shRNA) underwent antibiotic selection. (A) ASCs were labeled with Cell Tracker Green (10μM) and seeded atop the CAM of 10-day-old chick embryos. After 3 days, CAM cross-sections were stained with DAPI and visualized by fluorescent microscopy. Dashed lines outline the upper CAM surface such that cells below the dashed line demarcate invading ASCs. Bar represents 10 μM. (B) CAM invasion is quantified as the number of ASCs that cross the CAM surface and average depth of the leading front of the invading cells. Values are means of three independent fields. Bars, ± SD. *P < .01., **P < .001.
Acknowledgments
The authors thank Dina Gaupp, Alan Tucker, Elise LeMelle, Monique Westley, Willie Sparkman, Ashley Sankey, Forum Shah, and Xiying Wu for their valuable technical assistance. The work was supported by funds from Tulane University (B.A.B.) and the Pennington Biomedical Research Center (J.M.G.) and grants from the National Center for Research Resources (5P20RR016456-11) (H.E.M.) and the National Institute of General Medical Sciences (8 P20GM103424-11) (H.E.M.) from the National Institutes of Health.
The work was supported by funds from Tulane University and the Pennington Biomedical Research Center and grants from the National Center for Research Resources (5P20RR016456-11) and the National Institute of General Medical Sciences (8 P20GM103424-11) from the National Institutes of Health.
Footnotes
Author Contributions:
A.L.S.: Conception and design, collection and assembly of data, data analysis and interpretation, manuscript writing
J.A.S.: Conception and design, data analysis and interpretation
T.A.S.: Collection and assembly of data
T.T.S.: Collection and assembly of data
S.Z.: Collection and assembly of data
H.E.M.: Conception and design, financial support, data analysis and interpretation
J.M.G: Conception and design, financial support, data analysis and interpretation
B.A.B.: Conception and design, financial support, data analysis and interpretation, final approval of manuscript
Disclosure of potential conflicts of interest
The authors declare no competing financial interest.
References
- 1.Agnoli C, Berrino F, Abagnato CA, et al. Metabolic syndrome and postmenopausal breast cancer in the ORDET cohort: A nested case-control study. Nutr Metab Cardiovasc Dis. 2010;20:41–48. doi: 10.1016/j.numecd.2009.02.006. [DOI] [PMC free article] [PubMed] [Google Scholar]
- 2.Calle EE, Rodriguez C, Walker-Thurmond K, et al. Overweight, obesity, and mortality from cancer in a prospectively studied cohort of U.S. adults. N Engl J Med. 2003;348:1625–1638. doi: 10.1056/NEJMoa021423. [DOI] [PubMed] [Google Scholar]
- 3.Healy LA, Ryan AM, Carroll P, et al. Metabolic syndrome, central obesity and insulin resistance are associated with adverse pathological features in postmenopausal breast cancer. Clin Oncol. 2010;22:281–288. doi: 10.1016/j.clon.2010.02.001. [DOI] [PubMed] [Google Scholar]
- 4.Petrelli JM, Calle EE, Rodriguez C, et al. Body mass index, height, and postmenopausal breast cancer mortality in a prospective cohort of US women. Cancer Causes Control. 2002;13:325–332. doi: 10.1023/a:1015288615472. [DOI] [PubMed] [Google Scholar]
- 5.Gu J, Young E, Patterson S, et al. Postmenopausal obesity promotes tumor angiogenesis and breast cancer progression in mice. Cancer Biol Ther. 2011;11:910–917. doi: 10.4161/cbt.11.10.15473. [DOI] [PMC free article] [PubMed] [Google Scholar]
- 6.Jotzu C, Alt E, Welte G, et al. Adipose tissue derived stem cells differentiate into carcinoma-associated fibroblast-like cells under the influence of tumor derived factors. Cell Oncol. 2011;34:55–67. doi: 10.1007/s13402-011-0012-1. [DOI] [PMC free article] [PubMed] [Google Scholar]
- 7.Zimmerlin L, Donnenberg AD, Rubin JP, et al. Regenerative therapy and cancer: in vitro and in vivo studies of the interaction between adipose-derived stem cells and breast cancer cells from clinical isolates. Tissue Eng Part A. 2011;17:93–106. doi: 10.1089/ten.tea.2010.0248. [DOI] [PMC free article] [PubMed] [Google Scholar]
- 8.Roufosse CA, Direkze NC, Otto WR, et al. Circulating mesenchymal stem cells. Int J Biochem Cell Biol. 2004;36:585–597. doi: 10.1016/j.biocel.2003.10.007. [DOI] [PubMed] [Google Scholar]
- 9.Stetler-Stevenson W, Yu AE. Proteases in invasion: matrix metalloproteinases. Semin Cancer Biol. 2002;11:143–153. doi: 10.1006/scbi.2000.0365. [DOI] [PubMed] [Google Scholar]
- 10.Matrisian L, Sledge GJ, Mohla S. Extracellular proteolysis and cancer: meeting summary and future directions. Cancer Res. 2003;63:6105–6109. [PubMed] [Google Scholar]
- 11.Ahmadian Kai N, Bahrami A, Ebrahimi M, et al. Comparative analysis of chemokine receptor’s expression in mesenchymal stem cells derived from human bone marrow and adipose tissue. J Mol Neurosci. 2011;44:178–185. doi: 10.1007/s12031-010-9446-6. [DOI] [PubMed] [Google Scholar]
- 12.Yu G, Floyd E, Wu X, et al. Isolation of Human Adipose-Derived Stem Cells from Lipoaspirates. Methods in Molecular Biology. 2011;702:17–27. doi: 10.1007/978-1-61737-960-4_2. [DOI] [PubMed] [Google Scholar]
- 13.Izadpanah R, Trygg C, Patel B, et al. Biologic properties of mesenchymal stem cells derived from bone marrow and adipose tissue. Journal of Cellular Biochemistry. 2006;99:1285–1297. doi: 10.1002/jcb.20904. [DOI] [PMC free article] [PubMed] [Google Scholar]
- 14.Kohrmann A, Kammerer U, Kapp M, et al. Expression of matrix metalloproteinases (MMPs) in primary human breast cancer and breast cancer cell lines: New findings and review of the literature. BMC Cancer. 2009;9:188. doi: 10.1186/1471-2407-9-188. [DOI] [PMC free article] [PubMed] [Google Scholar]
- 15.Hagedorn M, Javerzat S, Gilges D, et al. Accessing key steps of human tumor progression in vivo by using an avian embryo model. Proceedings of the National Academy of Sciences of the United States of America. 2005;102:1643–1648. doi: 10.1073/pnas.0408622102. [DOI] [PMC free article] [PubMed] [Google Scholar]
- 16.Li X-Y, Ota I, Yana I, et al. Molecular Dissection of the Structural Machinery Underlying the Tissue-invasive Activity of Membrane Type-1 Matrix Metalloproteinase. Molecular Biology of the Cell. 2008;19:3221–3233. doi: 10.1091/mbc.E08-01-0016. [DOI] [PMC free article] [PubMed] [Google Scholar]
- 17.Lu C, Li X-Y, Hu Y, et al. MT1-MMP controls human mesenchymal stem cell trafficking and differentiation. Blood. 2010;115:221–229. doi: 10.1182/blood-2009-06-228494. [DOI] [PMC free article] [PubMed] [Google Scholar]
- 18.Tufan A, Satiroglu-Tufan N. The chick embryo chorioallantoic membrane as a model system for the study of tumor angiogenesis, invasion and development of anti-angiogenic agents. Curr Cancer Drug Targets. 2005;5:249–266. doi: 10.2174/1568009054064624. [DOI] [PubMed] [Google Scholar]
- 19.Ries C, Egea V, Karow M, et al. MMP-2, MT1-MMP, and TIMP-2 are essential for the invasive capacity of human mesenchymal stem cells: differential regulation by inflammatory cytokines. Blood. 2007;109:4055–4063. doi: 10.1182/blood-2006-10-051060. [DOI] [PubMed] [Google Scholar]
- 20.Hanahan D, Weinberg R. Hallmarks of cancer: the next generation. Cell. 2011;144:646–674. doi: 10.1016/j.cell.2011.02.013. [DOI] [PubMed] [Google Scholar]
- 21.Bellows CF, Zhang Y, Simmons PJ, et al. Influence of BMI on Level of Circulating Progenitor Cells. Obesity. 2011;19:1722–1726. doi: 10.1038/oby.2010.347. [DOI] [PMC free article] [PubMed] [Google Scholar]
- 22.Bellows CF, Zhang Y, Chen J, et al. Circulation of Progenitor Cells in Obese and Lean Colorectal Cancer Patients. Cancer Epidemiology Biomarkers & Prevention. 2011;20:2461–2468. doi: 10.1158/1055-9965.EPI-11-0556. [DOI] [PMC free article] [PubMed] [Google Scholar]
- 23.Cho NH, Hong KP, Hong SH, et al. MMP expression profiling in recurred stage IB lung cancer. Oncogene. 2003;23:845–851. doi: 10.1038/sj.onc.1207140. [DOI] [PubMed] [Google Scholar]
- 24.Fu Y, Nagy JA, Brown LF, et al. Proteolytic cleavage of versican and involvement of ADAMTS-1 in VEGF-A/VPF-induced pathological angiogenesis. J Histochem Cytochem. 2011;59:463–473. doi: 10.1369/0022155411401748. [DOI] [PMC free article] [PubMed] [Google Scholar]
- 25.Zhu S, Zhou Y, Wang L, et al. Transcriptional upregulation of MT2-MMP in response to hypoxia is promoted by HIF-1α in cancer cells. Mol Carcinog. 2011;50:770–780. doi: 10.1002/mc.20678. [DOI] [PubMed] [Google Scholar]
- 26.Wood IS, Heredia FPd, Wang B, et al. Cellular hypoxia and adipose tissue dysfunction in obesity. Proc Nutr Society. 2009;68:370–377. doi: 10.1017/S0029665109990206. [DOI] [PubMed] [Google Scholar]
- 27.Noel D, Caton D, SRoche S, et al. Cell specific differences between human adipose-derived and mesenchymal–stromal cells despite similar differentiation potentials. Exp Cell Res. 2008;314:1575–1584. doi: 10.1016/j.yexcr.2007.12.022. [DOI] [PubMed] [Google Scholar]
- 28.Peroni D, Scambi I, Pasini A, et al. Stem molecular signature of adipose-derived stromal cells. Exp Cell Res. 2008;314:603–615. doi: 10.1016/j.yexcr.2007.10.007. [DOI] [PubMed] [Google Scholar]
- 29.Vaisid T, Kosower NS, Katzav A, et al. Calpastatin levels affect calpain activation and calpain proteolytic activity in APP transgenic mouse model of Alzheimer’s disease. Neurochem Int. 2007;51:391–397. doi: 10.1016/j.neuint.2007.04.004. [DOI] [PubMed] [Google Scholar]
- 30.Blomgren K. Calpastatin Is upregulated and acts as a suicide substrate to calpains in neonatal rat hypoxia-ischemia. Ann N Y Acad Sci. 1999;890:270–271. doi: 10.1111/j.1749-6632.1999.tb08002.x. [DOI] [PubMed] [Google Scholar]
- 31.Sorimachi H, Ishiura S, Suzuki K. Structure and physiological function of calpains. Biochem J. 1997;328:721–732. doi: 10.1042/bj3280721. [DOI] [PMC free article] [PubMed] [Google Scholar]
- 32.Averna M, De Tullio R, Salamino F, et al. Age-dependent degradation of calpastatin in kidney of hypertensive rats. J Biol Chem. 2001;276:38426–38432. doi: 10.1074/jbc.M101936200. [DOI] [PubMed] [Google Scholar]
- 33.Storr SJ, Carragher NO, Frame MC, et al. The calpain system and cancer. Nat Rev Cancer. 2011;11:364–374. doi: 10.1038/nrc3050. [DOI] [PubMed] [Google Scholar]
- 34.Storr SJ, Mohammed RAA, Woolston CM, et al. Calpastatin is associated with lymphovascular invasion in breast cancer. Breast. 2011;20:413–418. doi: 10.1016/j.breast.2011.04.002. [DOI] [PubMed] [Google Scholar]
- 35.Bai D-S, Dai Z, Zhou J, et al. Capn4 overexpression underlies tumor invasion and metastasis after liver transplantation for hepatocellular carcinoma. Hepatology. 2009;49:460–470. doi: 10.1002/hep.22638. [DOI] [PubMed] [Google Scholar]
- 36.Undyala VV, Dembo M, Cembrola K, et al. The calpain small subunit regulates cell-substrate mechanical interactions during fibroblast migration. J Cell Sci. 2008;121:3581–3588. doi: 10.1242/jcs.036152. [DOI] [PMC free article] [PubMed] [Google Scholar]
- 37.Rodeheffer MS, Birsoy Kv, Friedman JM. Identification of White Adipocyte Progenitor Cells In Vivo. Cell. 2008;135:240–249. doi: 10.1016/j.cell.2008.09.036. [DOI] [PubMed] [Google Scholar]
- 38.Zimmerlin L, Donnenberg VS, Pfeifer ME, et al. Stromal vascular progenitors in adult human adipose tissue. Cytometry Part A. 2010;77A:22–30. doi: 10.1002/cyto.a.20813. [DOI] [PMC free article] [PubMed] [Google Scholar]
- 39.Baglioni S, Cantini G, Poli G, et al. Functional Differences in Visceral and Subcutaneous Fat Pads Originate from Differences in the Adipose Stem Cell. PLoS ONE. 2012;7:e36569. doi: 10.1371/journal.pone.0036569. [DOI] [PMC free article] [PubMed] [Google Scholar]
- 40.Baglioni S, Francalanci M, Squecco R, et al. Characterization of human adult stem-cell populations isolated from visceral and subcutaneous adipose tissue. The FASEB Journal. 2009;23:3494–3505. doi: 10.1096/fj.08-126946. [DOI] [PubMed] [Google Scholar]
- 41.Klopp AH, Zhang Y, Solley T, et al. Omental Adipose Tissue‚ Derived Stromal Cells Promote Vascularization and Growth of Endometrial Tumors. Clinical Cancer Research. 2012;18:771–782. doi: 10.1158/1078-0432.CCR-11-1916. [DOI] [PMC free article] [PubMed] [Google Scholar]
- 42.Sbarbati A, Accorsi D, Benati D, et al. Subcutaneous adipose tissue classification. Eur J Histochem. 2010;54:218–222. doi: 10.4081/ejh.2010.e48. [DOI] [PMC free article] [PubMed] [Google Scholar]
- 43.Schipper BM, Marra KG, Zhang WB, et al. Regional anatomic and age effects on cell function of human adipose-derived stem cells. Ann Plast Surg. 2008;60:538–544. doi: 10.1097/SAP.0b013e3181723bbe. [DOI] [PMC free article] [PubMed] [Google Scholar]
Associated Data
This section collects any data citations, data availability statements, or supplementary materials included in this article.
Supplementary Materials
Supplemental Material 1. Donor demographics.
Supplemental Material 2. Primer sets used in amplification of ASC mRNA regions.
RNA was extracted from ASCs primed with breast cancer conditioned media. Analysis of RNA expression of ASCs was analyzed by gel electrophoresis. β-actin is shown as a standard reference. Primer sets are listed in Supplemental Material 2.
Densitometry was performed on RT-PCR gel electrophoresis and represented as a ratio relative to β-actin. Bars, ± SD. *P < .05.
Protein lysate was isolated from ASCs isolated from 24 donors and primed with breast cancer conditioned media. Where indicated, samples isolated from donors with the same obesity status or depot site were pooled together for analysis. A total of 20 μg of protein was separated by SDS-PAGE under reducing conditions, blotted, and probed for MMP-15, calpain-4, and calpastatin. Bars, ± SD. *P < .05.