


Figure 2.
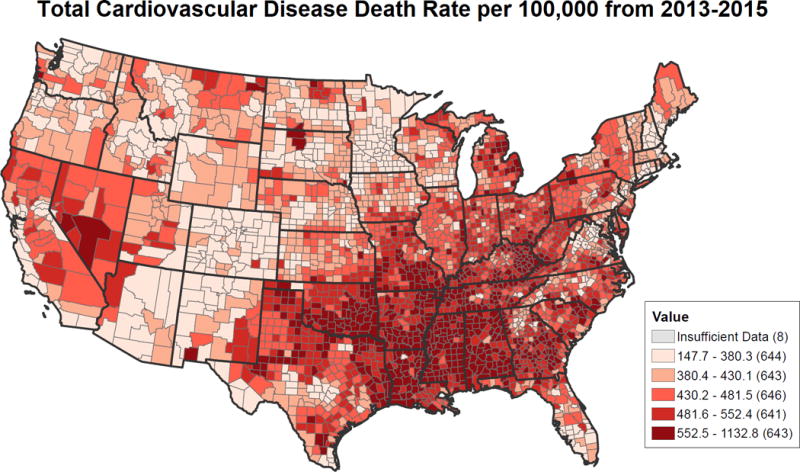
Cardiovascular disease death rates in individuals aged ≥35, by county between 2013-2015. Rates are spatially smoothed to enhance the stability of rates in counties with small populations. Data sources are the National Vital Statistics System and National Center for Health Statistics. This map was created using the Interactive Atlas of Heart Disease and Stroke, a website developed by the Centers for Disease Control and Prevention, Division for Heart Disease and Stroke Prevention.96