


Figure 4.
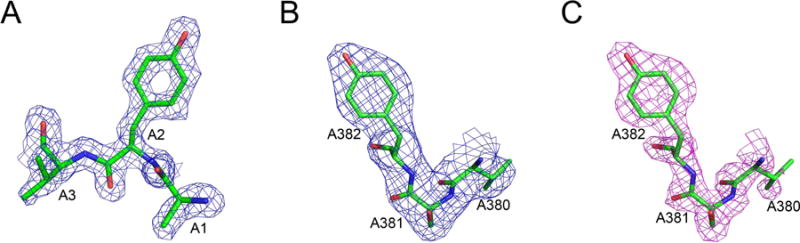
A comparison of the maps showing well-defined tyrosine residues in representative crystal and cryo-EM structures at 1.8 Å resolution. A) The N terminal residues Ala1-Tyr2-Val3 in ferredoxin, with a map contour level at 1σ. B–C) Residues ValA380-SerA381-TyrA382 in glutamate dehydrogenase. The original cryo-EM map (B) and the sharpened map (C) were both contoured at 3σ.