


Table S2.
Top enriched pathways through GSEA: The top 10 down-regulated enriched Reactome pathways
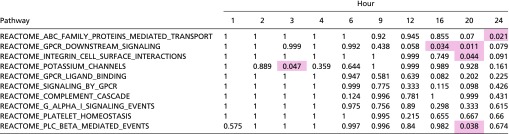 |
The analysis examined log fold changes of genes between OS and PS. Values represent P values that were corrected for familywise error rate with a Bonferroni correction. Values highlighted in red are <0.05. The pathways were sorted by increasing P values, with sorting on the first hour, then the second hour, until reaching the 24th hour.