


Figure 1.
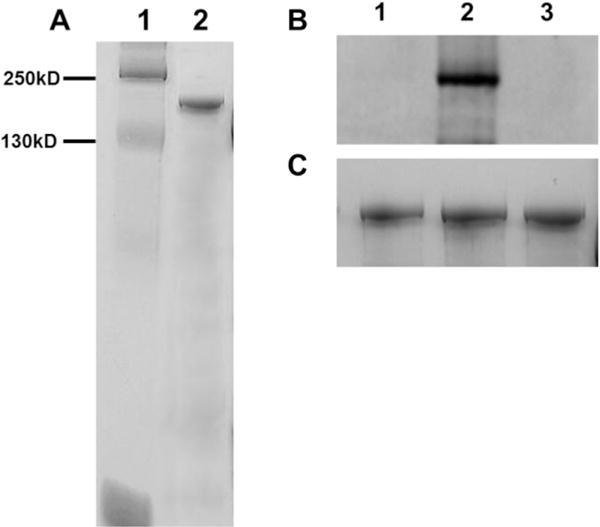
Gel electrophoresis and phosphorylation analysis of purified porcine c-MyBPC. (A) SDS–PAGE (12.5%) Coomassie Blue-stained gel showing the purity of full-length purified porcine c-MyBPC used in this study. The molecular masses of the markers are reported in lane 1. Lane 2 contained purified c-MyBPC, which is represented as an ~140 kDa band on the SDS–PAGE gel. (B) Pro-Q Diamond staining of untreated c-MyBPC (control lane 1) and c-MyBPC treated with PKA (lane 2) or calf intestinal alkaline phosphatase (lane 3). (C) Corresponding Coomassie Blue staining demonstrating equivalent protein loads for the three groups.