


Figure 4.
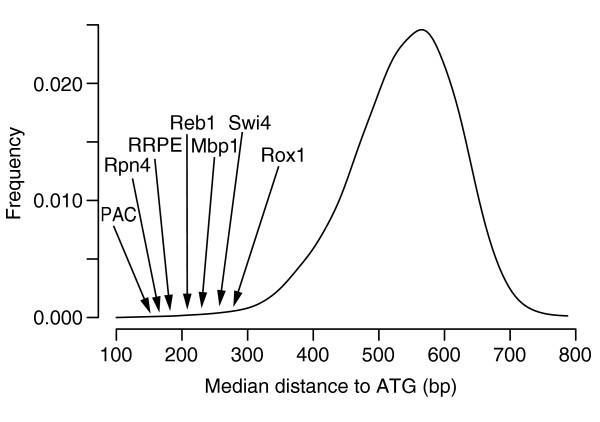
Distribution of median distances to ATG of all 7-mers, obtained when applying FastCompare to S. cerevisiae and S. bayanus. For each 7-mer, a median distance to ATG was calculated using the positions of matches upstream of S. cerevisiae genes within the conserved set for this 7-mer. The 8,170 median distances were then binned into 20-bp bins, and the resulting histogram was smoothed using a normal kernel. The median distances for several known binding sites in S. cerevisiae are also indicated (see Table 1).