


Figure 3.
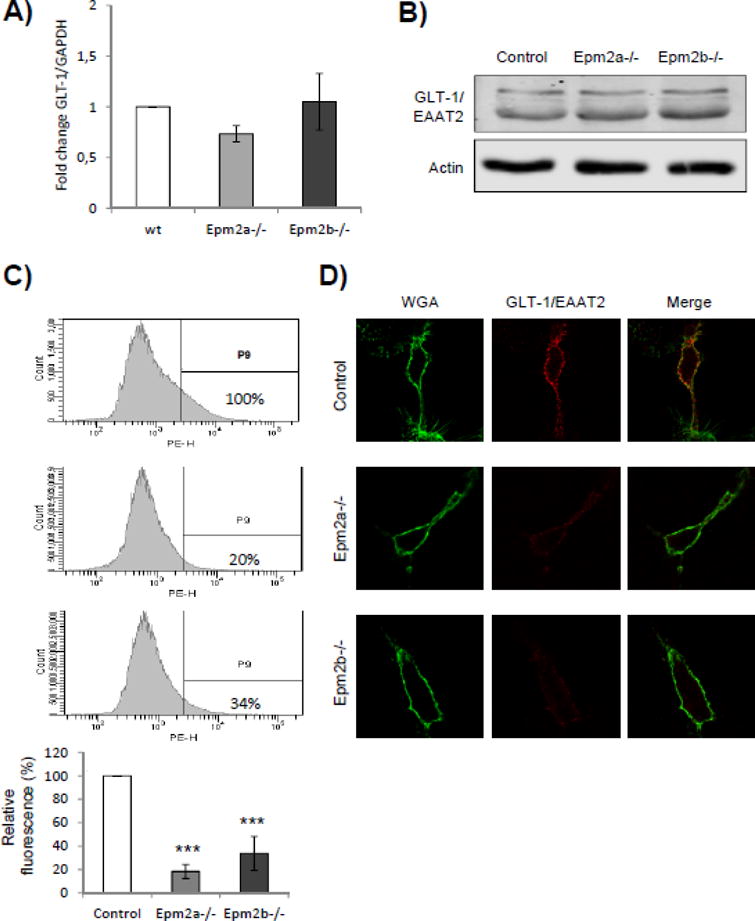
Levels of GLT-1 transporter are decreased at the plasma membrane of primary astrocytes from LD mice. A) qRT-PCR analysis of the expression of SLC1A2 gene encoding the GLT-1 glutamate transporter. qRT-PCR was performed in at least three independent samples of primary astrocytes from control and LD mice, as described in Materials and Methods; bars indicate standard deviation. B) Western blot analyses of the total levels of GLT-1 in primary astrocytes. Crude extracts (30 μg) from primary astrocytes from control and LD mice were prepared and analyzed by immunoblotting using anti-EAAT2 and anti-actin (loading control) antibodies. No differences were observed in the total amount of GLT-1 in the different samples. C) Analysis of the levels of GLT-1/EAAT2 transporter at the plasma membrane by flow cytometry. Primary astrocytes from control and LD mice were analyzed under native conditions by flow cytometry, as described in Materials and Methods, using mouse anti-EAAT2 and phycoerythrin-conjugated goat anti-mouse antibodies. Graphics represent the levels of phycoerythrin (PE)-dependent fluorescence respect to the number of cells (count); the vertical line separates the PE-dependent fluorescence (P9) from unspecific cellular signals (this threshold was determined using cells without anti-EAAT2 antibody). PE-dependent fluorescence levels in the samples were referred to the levels found in the primary astrocytes from control mice (100%). Flow cytometry analyses were repeated three times and the mean relative fluorescence of each type of primary astrocytes is indicated in the bottom panel (bars indicate standard deviation, asterisks denote significant differences comparing the corresponding groups with values from control astrocytes; ***p<0.001 using ANOVA test). D) Similar samples of these cells were also analyzed by immunofluorescence using anti-EAAT2 antibodies and Wheat Germ Agglutinin (WGA) Alexa Fluor 488 conjugate (to mark plasma membrane). Fluorescence of the two markers was merged to demonstrate the co-localization of the signals.