


Figure 5. Direct Effect of DMF on T cells in vitro.
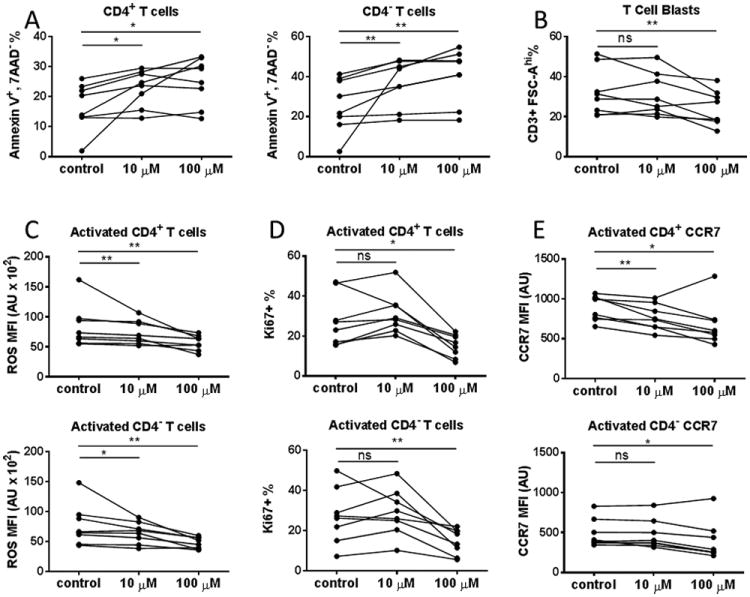
PBMCs derived from 8 healthy donors were isolated and cultured in the absence or presence of 10μM or 100μM DMF for 48 hours. (A) DMF-induced T cell apoptosis in vitro. Cultured PBMCs were harvested, washed and surface stained with fluorochrome-conjugated antibodies against CD3, CD8, CD4, as well as 7AAD and Annexin V. The frequency of apoptotic cells (AnnexinV+7AAD-) among total CD3+ CD4+ (left) and CD3+ CD4- (right) T cells in the vehicle control and10μM or 100μM DMF-treated groups are shown. (B) DMF suppressed T cell activation in vitro. PBMCs from healthy donors were cultured in the presence or absence of DMF for 48 hours on plates coated with anti-CD3 and soluble anti-CD28 antibodies to activate T cells. The percentage of activated T cell blast (CD3+ FSC-Ahi) was shown. (C) DMF-induced reduction of ROS level in activated T cells. Plate-bound anti-CD3/soluble anti-CD28 activated PBMC cultures from healthy donors with or without DMF were harvested and stained with antibodies against CD3, CD4, followed by staining of ROS with CM-H2DCFDA. The level of ROS on CD4+ (upper) and CD4- T cell (lower) blasts (CD3+ FSC-Ahi) are expressed as arbitrary units (AU) of mean fluorescence intensity. We also repeated the statistical calculations with the patient showing most reduction removed, the data still showed significant reductions (p<0.05). (D) DMF inhibited T cell proliferation in vitro. T cells from healthy donors were activated in the presence or absence of DMF for 48hours on plates with immobilized anti-CD3 and soluble anti-CD28 antibodies. After culture, cells were surfaced stained with CD3, CD4 and CD69, followed by intracellular staining of Ki67 to measure cell proliferation. The frequency of Ki67+ cells among CD69+ population of CD4+ (upper panel) and CD4- (lower panel) T cells are shown. (E) DMF reduced CCR7 expression on activated T cells in vitro. T cells were activated in the presence or absence of DMF for 48 hours on plates with immobilized anti-CD3 and soluble anti-CD28 antibodies. After culture, cells were surfaced stained with fluorochrome-conjugated antibodies against CD3, CD4 and CCR7. CD3+ T blasts were gated and CCR7 geometric mean fluorescence intensity (MFI; expressed in arbitrary units (A. U.)) was compared among vehicle control, 10μM DMF and 100μM DMF groups, respectively. P values from Wilcoxon signed rank test for the comparisons between control vs. 10 μM and control vs. 100 μM are shown above the data for each cell type group.*P < 0.05; **P < 0.01; ***P < 0.001; ns, not significant.