


Figure 6. EPH signaling is important to DIPG invasion.
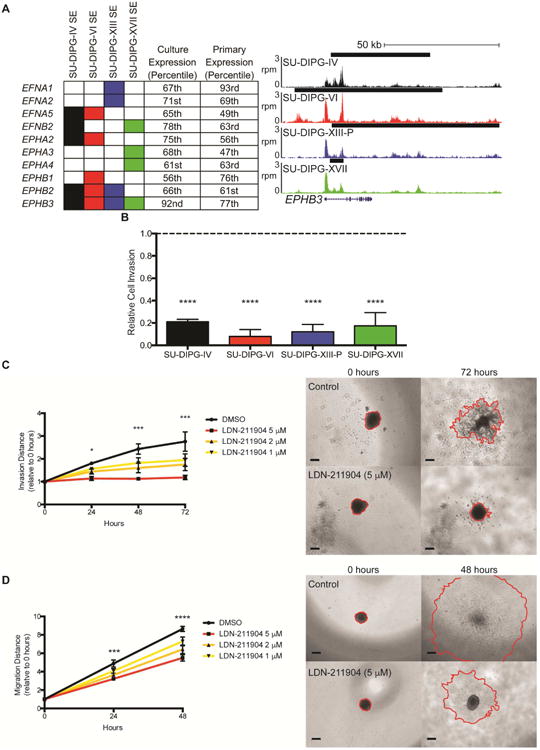
A) EPH receptors and ephrins associated with a SE in DIPG. Filled in rectangles represent association with a SE in the indicated cell culture. Expression percentiles shown for mean expression value either in the four cell cultures indicated or SU-DIPG primary tumor samples published in Grasso et al. 2015. For genome tracks shown, the x-axis represents genomic position and y-axis shows normalized reads per million (rpm). Black bars represent SE calls. B) Transwell matrigel invasion following treatment with LDN-211904 (5 μM). Invading cell quantification was normalized to mean DMSO invasion. p value vs DMSO: SU-DIPG-IV 0.0006, SU-DIPG-VI 0.0003, SU-DIPG-XIII-P 0.0004, SU-DIPG-XVII 0.0004. C) (left) Quantification of invasion distance of SU-DIPG-XVII cells treated with LDN-211904 at the concentrations indicated or DMSO control. Invasion distance normalized to Day 0 distance for each sphere. p values of DMSO vs 5 mM LDN-211904: 24 hours = 0.0311, 48 hours = 0.0005, 72 hours = 0.0001. (right) Representative images of spheroid invasion at 0 and 72 hours, with leading edge outlined in red. Scale bars = 200 μm. D) (left) Quantification of migration distance of SU-DIPG-IV cells treated with LDN-211904 at the concentrations indicated or DMSO control. Migration distance normalized to Day 0 distance for each sphere. Student's two-tailed t-test (FDR = 0.05) between DMSO and 5 μM LDN-211904, * indicates FDR-adjusted p value < 0.05. (right) Representative images of spheroid migration at 0 and 48 hours, with leading edge outlined in red. Scale bars = 200 μm. Data shown as mean ± s.e.m. (n=3); Student's t-test with Holm-Sidak adjustment unless otherwise indicated. See also Figure S5.