


Figure 2. Conservation of the posterior glycolytic gradient in the chicken embryo.
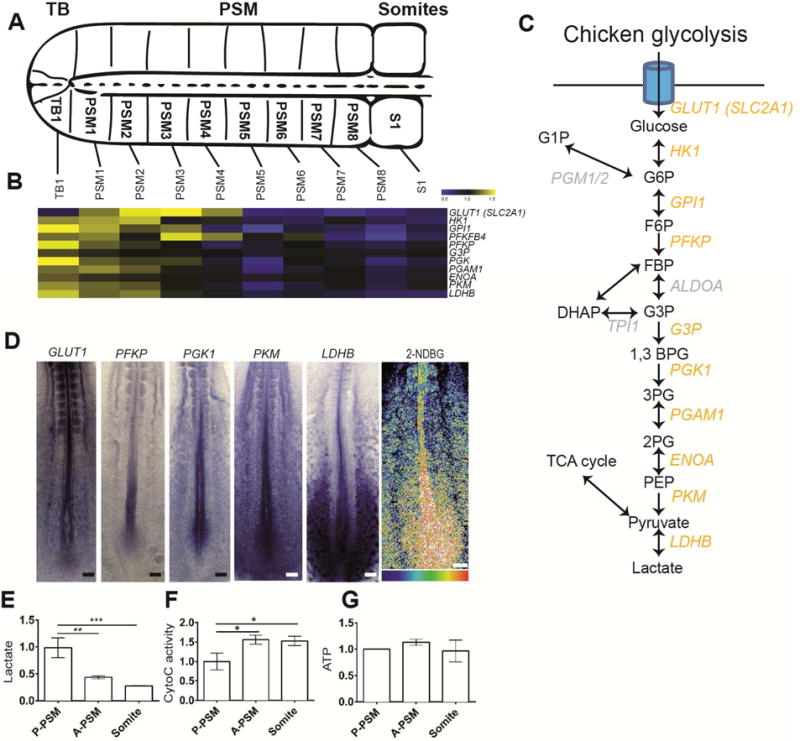
(A). Schematic representation of the posterior portion of a two-day old chicken embryo. The fragments micro-dissected to generate the microarray series are indicated. Dorsal view, anterior to the right. TB: Tail bud, PSM: Presomitic Mesoderm.
(B) Expression profiles of transcripts coding for glycolytic enzymes down-regulated in chicken PSM during differentiation as detected in the microarray series. Each value is normalized to the mean of MAS values of all duplicate chicken microarray series. Color bar shows fold change from mean.
(C) Schematic representation of the chicken glycolytic cascade. Yellow labeling indicates the glycolytic enzymes whose transcripts are downregulated in the chicken embryo tail bud and PSM.
(D) Left, posterior region of 2-day chicken embryos hybridized with probes for the glucose transporter GLUT1, and for the glycolytic enzymes PFKP, PGK1, PKM and LDHB. Right, fluorescent glucose (2-NDBG) uptake in the posterior region of a 2-day chicken embryo (n=11). Maximum projection of confocal sections. Fluorescence intensity is shown by pseudocolor image (16 color) using image J. Higher levels of fluorescent 2-NDBG are indicated in red-yellow. Ventral view, anterior to the top. Scale bar :100 μm.
(E–G) Enzymatic detection of relative lactate level, Cytochrome C oxidase activity, and relative ATP concentration during tail bud differentiation. Graphs represent triplicate experiments. Values were normalized by the P-PSM, Error bars ±SD. Statistical significance was assessed with one way ANOVA followed by Tukey’s test, * p<0.05, ** p<0.01, *** p<0.001).