


Fig. 2.
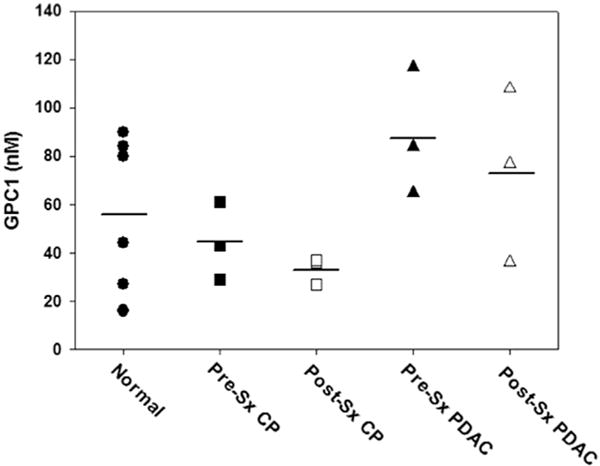
Dot plot of exosomal glypican-1 levels in normal controls, pancreatic cancer, and chronic pancreatitis. Glypican-1 (GPC1) levels were measured by LC-MS/MS using exosomes isolated from6 normal controls (circles), 3 patientswith pancreatic cancer (PDAC; squares), and 3 patients with chronic pancreatitis (CP; triangles). Pre-surgery (Pre-Sx; solid symbols) and post-Sx (open symbols) sampleswere assayed separately. Horizontal lines: mean values. There were no significant differences between the three groups, or between the pre- and post-surgery samples, either by ANOVA or paired t-tests.