


FIGURE 7.
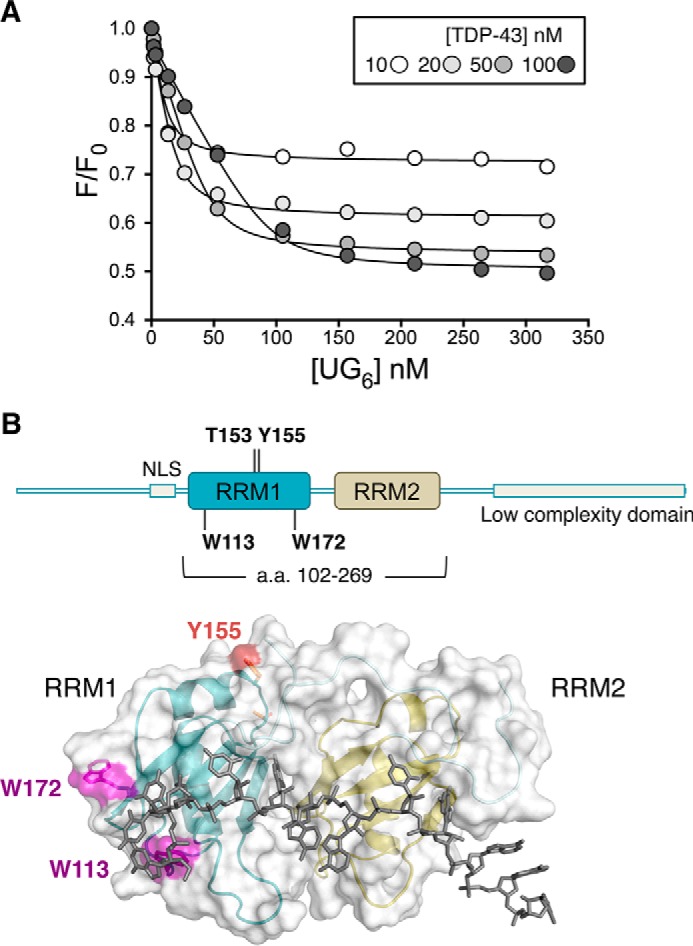
Fluorescence-based assay to measure TDP-43 RNA binding affinity for GU-repeats. A, intrinsic fluorescence (F) of recombinant TDP-43 upon titration of A(UG)6 RNA normalized by the fluorescence in the absence of RNA (F0). Shown are F/F0 values at four different TDP-43 concentrations and data were analyzed according to Equations 1 and 2 under “Experimental Procedures.” The best fit values for the apparent equilibrium dissociation constant, Kd(app), are shown in Table 1. B, schematic representation of full-length TDP-43 highlighting Trp-113 and Trp-172 in RRM1. Lower panel shows the surface and ribbon representation of the 102–269 fragment bound to GU-rich RNA (36). Tryptophan residues in RRM1 are highlighted in magenta.