


Figure 6.
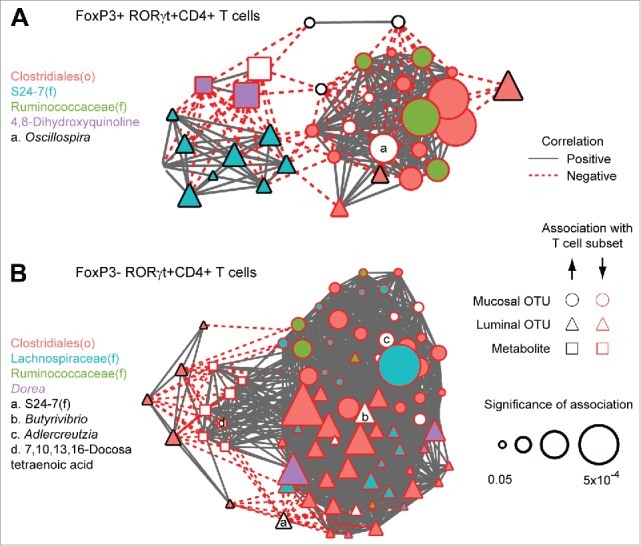
FoxP3+ and FoxP3- RORγt+CD4+ (T) cells are associated with the abundance of Clostridiales and S24–7 OTUs. (A) Nodes represent luminal OTUs, mucosal OTUs, and metabolites that are differentially abundant in Tsyn mice at week 5 and significantly associated with the frequency of FoxP3+RORγt+CD4+ T cells after adjustment for time point, genotype, and location. Node size reflects the significance of association (q-values). Edges represent statistically significant correlations (q<0.05) between nodes after adjustment for time point, genotype, and location. Microbial taxa and metabolites are labeled by fill color or letters. (B) Network depicting microbes and metabolites that are differentially abundant in Tsyn mice at weeks 3 and/or 9 (but not week 5) associated with FoxP3-RORγt+CD4+ T cells.